There are speculations that infographics are losing their effectiveness in content marketing. Despite making these speculations myself several years ago, I have to disagree and eat my words – infographics are here to stay.
As a means of visual communication, infographics have been around for centuries in the print press. But it’s arguable that the intentions have changed. Back then, infographics were an effective way of ‘conveying a thousand words’ and saving column inches, whereas today they’re more or less built for links, social shares, and other indirect signals that collectively increase one’s site traffic.
The big change over the past three years is that with so much competition the bar for creating a great infographic has been raised. You can no longer get away with slapping ten factoids into a PSD and expecting it to go viral. So how do you create a great infographic that stands out? Here are some of the lessons I’ve learned over the years.
Start at the end
When creating an infographic, I find it useful to start at the end goal and work backwards. If there were no limits, what would be amazing? What would get 1,000+ shares and drive links, traffic, and awareness for the next 2-3 years? What are our audience’s burning questions or confusions that we could solve?
When you have an idea of what could be amazing, you can then work backwards to what’s possible – or what it would take to create your great idea. The alternative (starting with the data & ideas you have) leads to less creative ideas that are more likely to flop.
What’s your story?
It’s cliché, but infographic design is about storytelling. Most mediocre infographics make the mistake of dumping a bunch of data into Photoshop and making it look like an infographic. The problem with this is that if the data doesn’t tell us anything new – or the story behind the data isn’t prominent – then it’s unlikely to entertain, inform, or have any emotional impact on the viewer.
If your story is how we’re approaching the end of the World, use data to tell me where we came from, what caused the downfall, where we are now, and where we’re going. I want a story – not a data overdose!
On this note, clients often ask “should we collect our own data or can you find existing data for us?” This is a tough one. The former is my preference as it often leads to new insights and sexy stories, but it has the downside of sometimes being time consuming and sensitive. I’d say as a rule of thumb, if your data is incredible and you think you have some fascinating insights, then it’s probably worth using your own dataset, otherwise it’s likely easier to use publicly available data.
Make them angry!
The best infographics are emotive. They enrage, entertain, and envoke strong emotions that make it hard not to share. The deluge of Mac vs. PC infographics are a great example of this. If your infographic is neutral or doesn’t envoke any strong emotions, it’s unlikely to sail far in the blogosphere.
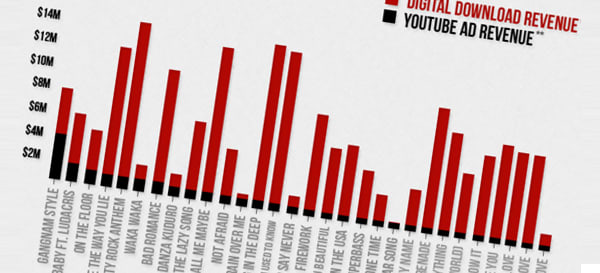
Again, work backwards on this. What topics are making people angry at the moment? In the music industry you could illustrate major record label monopolies, live sector monopolies (and increasing live ticket prices), download piracy, minuscule revenues paid by streaming services etc. Anything that gets your audience’s blood boiling.
Go topical or evergreen
After years of creating all kinds of content, I’ve come to the conclusion that content should either be evergreen (be relevant forever) or topical (be relevant for the next few days / weeks).
When a news story breaks or a trend emerges, it can be tough for journalists to stand out amongst all of the other ‘breaking news’ posts. By creating an infographic around a topical story you offer them an alternative that’s very likely to garner a good response from their readers.
The alternative is to create evergreen content, which may not generate as much attention in the short-term, but because it never goes ‘out of date’ it will still be driving links and shares in years to come. This kind of content is like creating a glacier. You have to add a lot of evergreen content to get it going, but once it is going it’s unstoppable.
A recent trend in infographic development is to use live data feeds in order to keep your infographic constantly up to date. We tried this with a few recent interactive HTML5 infographics that we developed and we’ve found them to generally be very effective.
Unlike typical infographics, which due to their static nature tend to go ‘out of date’ live infographics are evergreen due to the data being constantly updated in real time. The only downside to creating live infographics is the time investment (it took us around 6-7 days of design & coding, opposed to 3-4 for a typical infographic).
the Build it and they will come mindset
There’s no such thing as ‘build it and they will come’ in content marketing, you have to have a smart distribution strategy. I’ve found that even spending just 30 minutes tweeting relevant journalists with your infographic can work wonders in getting you content placed.
Build up your profiles on relevant social networks like Reddit, StumbleUpon, Facebook, and Digg. Do plenty of outreach to relevant bloggers, and distribute them on infographic sites like Visual.ly.