


With a free tool like Google Analytics offering one of the best analytics platforms on the market, it’s easy to understand why so many businesses never explore alternatives or more powerful options.
According to data from W3Techs, Google Analytics has a whopping 84.1% market share of traffic analysis tools but this doesn’t mean it’s necessarily the best analytics platform on the market.
In fact, it’s not even Google’s most powerful option.
So, in this article, we’re looking at the best analytics and business intelligence tools available right now, but firstly:
What is a Business Intelligence platform?
A business intelligence platform is a system to help businesses analyze and understand large quantities of data at a time. This enables them to better visualise their data and make more informed data-driven decisions.
You can utilise this in your business to gain a competitive advantage and ensure you’re making the correct decisions - but first, you’ll need to decide what platform works for your use case.
Which platforms are we looking at in this article?
We’re not going to look at Google Analytics or any free alternatives in this article. We’re only focusing on the very best analytics and business intelligence platforms in this article. And, while Google does earn a place on our list, we’re talking about an advanced suite of tools designed for enterprise businesses.
That said, if you’re looking for a free or affordable option, KlipFolio, WhataGraph and, of course, Google Analytics are the unanimous recommendations - it’s just not in the scope of this article.
Here’s a quick preview of the analytics and business intelligence platforms we’re looking at today:
- Google Marketing Platform (Enterprise)
- Microsoft Power BI
- Oracle Analytics Cloud
- Qlik
- Tableau
- IBM Cognos Analytics
- Sisense
- SAP BusinessObjects BI
- TIBCO Spotfire
- Looker
- YellowFin
So that gives you an idea of what we’re looking at in this article but let’s just take a moment to clarify the difference between an analytics and business intelligence platform - just so we’re 100% clear on what we’re talking about.
Analytics vs business intelligence - what’s the difference?
Strictly speaking, an analytics platform is a piece of software that collects analytical data and presents it in visual formats so that human users can make sense of the data, compare reports and spot trends.
The kind of analytics platforms we’re looking at in this article are web analytics tools that collect varying amounts of traffic and website performance data - anything from user location and device type to page visits and conversion rates.
If you’re reading this article, you’re probably already familiar with Google Analytics, so I’m not going to go into too much detail about this.
What might be less obvious is how a business intelligence platform differs from an analytics tool like Google Analytics. And the simple answer is that where an analytics tool collects and presents data for analysis, a business intelligence tool uses a broader range of business data to predict trends and outcomes.
This is an important distinction to understand but it’s also worth knowing that the line between analytics and business intelligence platforms has blurred a lot over the years and most enterprise options offer a certain amount of both - which is why we’re looking at analytics and business intelligence in this article.
Google Marketing Platform (Enterprise)
Google Marketing Platform is the complete suite of analytics and optimisation tools developed by Google to help you improve the performance of your website and Google Ads strategy.
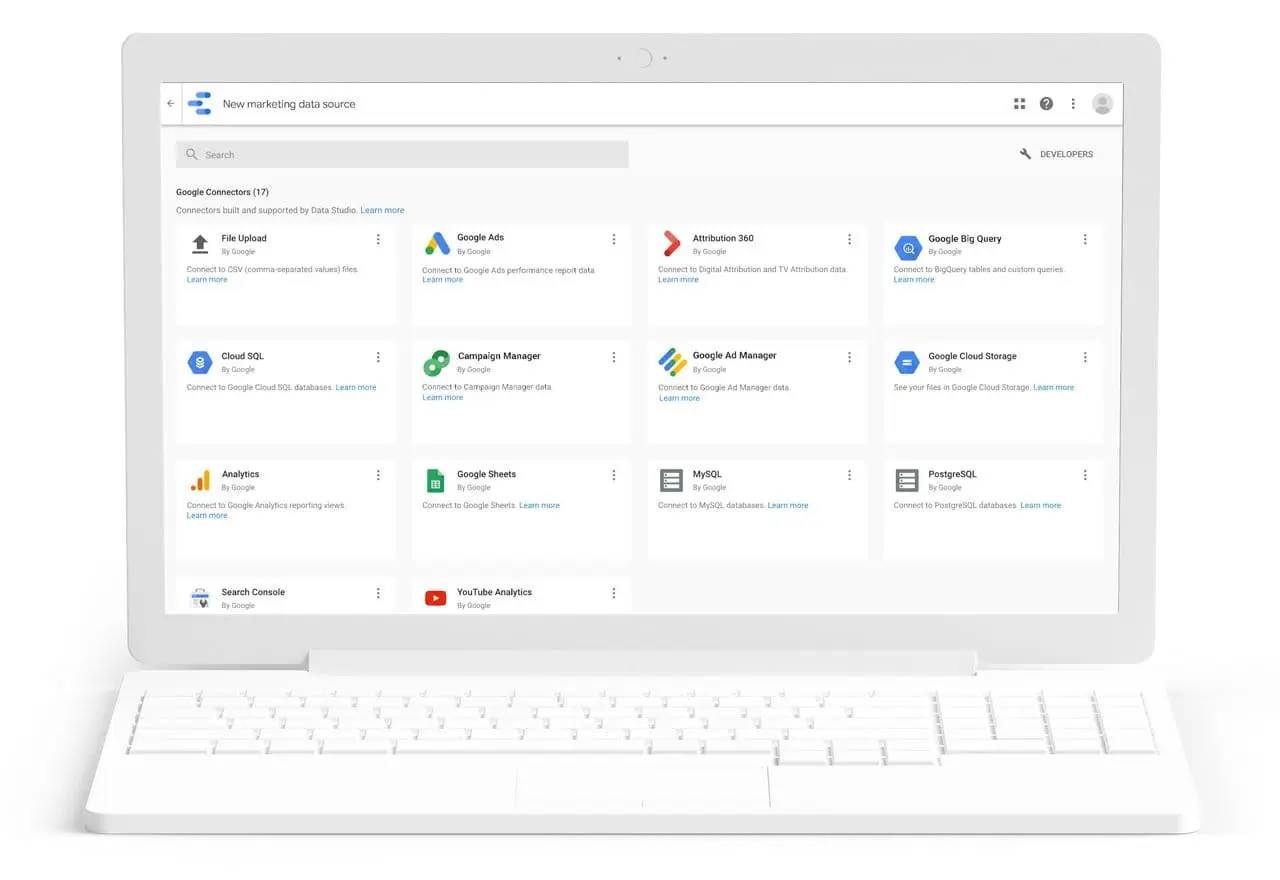
This includes Google Analytics, Data Studio and a range of other tools - and many of these have highly-capable free versions, much like Google Analytics.
However, the enterprise version of Google Marketing Platform provides the fully-featured suite of marketing tools designed to give you a 360-degree view of your online presence.
Key features:
- Google Analytics 360: Understand your customers to deliver better experiences.
- Data Studio: Bring your data to lie with engaging, customisable reports.
- Optimize 360: Test variations of your sites, pages and apps.
- Surveys 360: Get fast, reliable opinions from real people.
- Tag Manager 360: Manage all your tags without editing any code.
- Search Ads 360: Get real-time data and unified insights from your search campaigns.
- Display & Video 360: Reach today’s always-connected audiences wherever they are.
If you’re looking for something more capable than the free version of Google Analytics but already know the software well, the enterprise version of Google Marketing Platform is the obvious choice.
With Google Analytics 360, you get a serious upgrade in terms of features compared to the free version, including:
- Advanced analysis
- Advanced attribution modelling
- Dedicated account manager
- 24/7 emergency support
- Implementation support
- Training from Google Experts
- Google Drive integration
- Display & Video 360 integration
- Custom funnel reporting
- Unlimited data
- Raw data access
- “Real-time” data
- Full data ownership
You can find a more detailed comparison on the Marketing Platform website and Google Analytics 360 is only part of the package. The enterprise version of Google’s marketing suite also gives you access to the tech giant’s most advanced CRO platform, Optimize 360, and unlocks all of your paid advertising data through Google Ads 360.
Meanwhile, Data Studio gives you complete control over your data visualisations, allowing you to build fully-customised reports to meet your business needs.
Microsoft Power BI
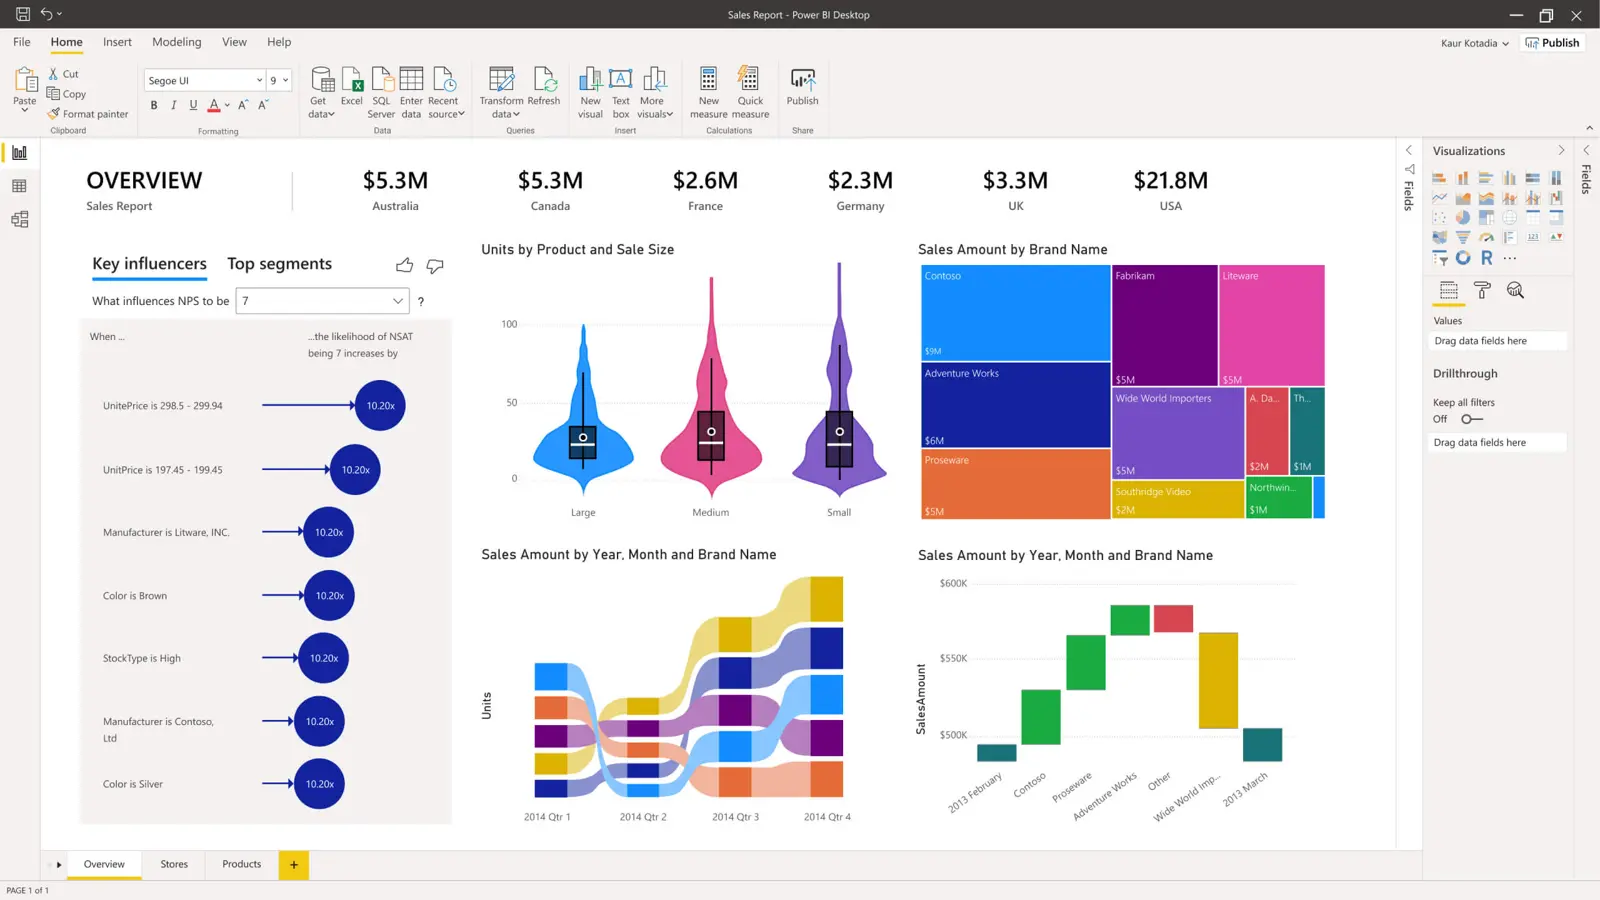
Microsoft Power BI brings us to our first business intelligence platform in this article and you don’t get any points for guessing what the “BI” stands for.
Where Google Marketing Platform focuses on website and marketing performance, Microsoft Power BI takes a more holistic look at business performance - whatever that means for your organisation.
Key features:
- Real-time reporting: Monitor business and process performance as it happens with real-time reports.
- Predictive analytics: Predict trends and future performance using artificial intelligence.
- AI diagnostics: Diagnose performance issues faster, once again using artificial intelligence.
- Microsoft AI: Microsoft’s industry-leading AI technology is a constant presence throughout the Power BI platform.
- Machine learning: Build your own machine learning models using Power BI.
- Microsoft Azure: Clean big data and prep your datasets faster using Azure data lakes.
- Excel integration: Seamless Excel integration makes both Power BI and the spreadsheet application more powerful data tools.
Power BI pulls in data from all of your data tracking software (analytics, sales reports, accounting software, etc.) and brings them all together so you can compile reports with all of your data.
The Microsoft platform also pulls in data from third-party sources, which means you’re not only relying on your owned data to make business decisions. For example, you can compare financial performance against market trends to see if changes in revenue - whether positive or negative - are reflective of market shifts.
Microsoft’s industry leading AI technology spots patterns and trends that your in-house teams might miss - or, at least, spot them sooner. This allows you to react to insights faster and Power BI’s predictive analytics forecasts performance issues before they even arise.
For organisations overwhelmed by big data and unimpressed with the business decisions they’re currently making from all of their data sources, Power BI can provide the intelligence you need.
Oracle Analytics Cloud
Bringing us back to true analytics, Oracle Analytics Cloud offers up one of the most powerful AI-driven platforms on the market.
The company’s “augmented analytics” applies smart data preparation and provides a natural-language discovery system that allows you to ask conversational questions and get insightful answers.
Key features:
- Augmented analytics: Powered by artificial intelligence and machine learning.
- Data discovery: Advanced data visualisations to make analysis easier and insights more obvious.
- Natural language processing: Ask Oracle conversational questions to gain insights faster.
- Data preparation: Prep your data for more relevant and accurate insights.
- Data publishing: Easily share and embed insights into documents and content for publishing.
- Predictive Analytics: Calculate future trends with greater accuracy with machine learning.
Thanks to Oracle’s AI prowess, you can also forecast future trends with greater accuracy using its predictive analytics models. You can use this to spot trends before they peak and diagnose performance issues before they start having a negative impact.
Another standout feature of Oracle Analytics Cloud is data publishing, which makes it easy to share and embed reports anywhere you want. So you can create reports and presentations for board members or investors to highlight the rewards of your team’s hard work or create data-journalism content by easily embedding insights into documents.
Qlik
Qlik is a data intelligence software provider that offers a range of tools for data analysis. The company offers two core products: QlikView, which is its standalone analytics tool and Qlik Sense as an integrated analytics and business intelligence platform.
Key features:
- QlikView: This is Qlik’s advanced analytics platform with the company’s built-in Associative Engine technology.
- Qlik Sense: Qlik’s complete data analytics and business intelligence platform.
- Qlik Insight Bot: Conversational analytics via bots and popular chat platforms such as Skype.
- Associative Engine: Explore your data without being limited to predefined segments.
- Machine intelligence: AI and machine learning insights.
- Advanced data prep: Clean and prepare your data for reports and algorithms.
- Offline mode: Access data and reports offline.
QlikView is the company’s advanced standalone analytics tool, built around its innovative Associative Engine technology that gives you complete control over your data.
Qlik Sense is the newer platform of the two, building upon Qlik’s many years of experience in the analytics business to incorporate the latest AI technology to deliver an augmented intelligence system. The platform is capable of making context-aware suggestions, sending you alerts for emerging trends and making data-driven predictions using machine learning.
With conversational analytics, you can ask the platform questions in everyday language and get insightful responses.
Tableau
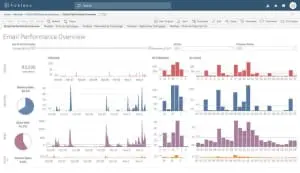
Tableau was one of the first companies to emerge with a self-service business intelligence and analytics platform. It remains one of the biggest names in the business and one of the most comprehensive, too, which means there’s a pretty solid learning curve to tackle if you want to get the best out of this platform.
Key features:
- Analytics: Advanced analytics with an award-winning visual interface.
- VizQL: Tableau’s innovative drag-and-drop visualisation builder for creating custom reports, the way you want them to look.
- Collaboration: Securely share interactive dashboards, keep on top of data with alerts & subscriptions, and use storytelling to share insights clearly.
- Content discovery: Make it easy for everyone to find the right data. Organize resources by project, recommend relevant data, allow ‘go back’ with revision history, and enable search.
- Data prep: Get your data ready for analysis with the same interactive, visual interface as the analytics platform.
Tableau pulls in data from your analytics and marketing tools (e.g.: Google Analytics, Salesforce, etc.) and combines it all into a single database. You can then use the platform’s built-in data preparation tools to clean and refine your data to improve the quality of your analytics.
One of Tableau’s signature features is called VizQL, a drag-and-drop builder for creating visualisations on the fly - a great feature for team members who have problems with conceptualising data in visual formats.
Tableau also has great collaboration features for teams and a content discovery system that makes it easy for everyone to find the data they need.
IBM Cognos Analytics
IBM Cognos Analytics is the upgrade to Cognos Business Intelligence, bringing a new cloud option, web-based interface, cognitive guidance and new data visualisation features.
This AI-powered platform comes from a true leader in data intelligence and it shows throughout Cognos Analytics. You can feed in data from third-party analytics tools like Google Analytics and CRM platforms like ActiveCampaign, as well as external data from third-party sources such as market reports and government data.
Key features:
- Custom dashboards: Create your own dashboards and prioritise data.
- Animated stories: Build animated reports to present your data.
- Conversational search: Explore data using conversational language.
- Pattern detection: Automatically detect patterns and anomalies in your data.
- Predictive analytics: Forecast trends and performance using artificial intelligence.
You can create your own dashboards and visualisations, use AI to detect hidden patterns, conversational search, collaborate with team members and share data/reports.
IMB offers a Cloud Edition and Enterprise Edition of Cognos Analytics. The Cloud Edition is designed for smaller businesses and there are Standard, Plus and Premium plans with prices starting at $15 per user, per month.
The Enterprise Edition provides a dedicated service, customised to meet your needs, and you can either host this on the cloud or on your own servers, on-premise.
Sisense
Formerly Periscope Data, Sisense is an API-first cloud technology that allows you to build your own analytics apps. So this isn’t a ready-to-use analytics platform but rather a toolset for building analytics software, whether it’s for your own business, clients or to sell as a product.
Key features:
- Embed: Embed analytics anywhere with full customisations and white labelling that are secure and scalable.
- Mashup: Mash up a combination of live or cached data models to optimise performance and manage resource utilisation.
- Analyse: Analyse data from across your entire data landscape and transform it into powerful visualisations and actionable application components.
- Impact: Impact business decisions and drive change with deep insights and answers to complicated questions.
- Deploy: Deploy on the cloud, on-premise, or hybrid using Linux or Windows.
- Control: Control access at system, object, data, and process levels, including recovery and audit trails.
If you’re looking to build an analytics system to meet your own needs or create bespoke apps for your clients, Sisense provides the tools you need. The platform builder slashes the time it takes to create interactive dashboards, self-service analytics or white-labelled business intelligent apps - both cloud and on-premise solutions.
SAP Analytics Cloud
SAP Analytics Cloud is an advanced analytics and business intelligence system that helps you turn data into insights faster. This is one of the most comprehensive all-in-one analytics and BI solutions on the market right now and this does mean the platform takes some time to get used to.
It’s also surprisingly affordable for a platform of this calibre with prices starting at $17 per month, per user.
Key features:
- Augmented Analytics: Powered by AI, machine learning, and natural language processing (NLP).
- Conversational analytics: Ask questions in a conversational way – and get instant answers, data visualisations, and explanations – with natural language processing and generation.
- Automated machine learning: Use machine learning algorithms to automatically reveal relationships, hidden patterns, and outliers in your data – and go from insight to action faster.
- Predictive analytics: Predict potential outcomes and generate forecasts you can trust with the push of a button – no data science skills required.
- Business Intelligence: Explore data across the organisation and deliver insights at the point of decision with intuitive self-service analytics.
- Enterprise Planning: Link and create financial and operational plans seamlessly in one solution to drive better decisions with integrated plans.
- Analytics applications: Create centrally governable analytic content – from guided analytics to sophisticated planning and smart applications.
SAP Analytics Cloud is a powerful system and its AI technology punches above the weight of its price tags. However, the platform’s data preparation features are a little flimsy and this is a good lesson in how important good data prep is.
The software will warn you that imported data needs to be sanitised when issues are detected but you have to dig into reports to find out what the issues are and often check a bunch of settings to diagnose the root of the problem, which can really slow you down.
Aside from that, SAP delivers impressive AI-driven insights, reliable predictive analytics and solid data visualisation options that compete with enterprise BI systems.
TIBCO Spotfire
TIBCO Spotfire is a search-orientated analytics platform that helps you visualise data and reports. The platform’s built-in artificial intelligence engine is capable of making recommendations, predictive analytics and performance forecasting.
Despite boasting some advanced features that earn TIBCO Spitfire a place in this article, the platform is much easier to use than most enterprise-level analytics and BI systems - thanks to intuitive UI design and an excellent drag-and-drop builder.
Key features:
- Smart visual analytics: Explore and visualise data through rich, interactive dashboards and point-and-click data.
- Intelligent data wrangling: Helps you quickly spot data outliers, inconsistencies, and deficiencies, helping you quickly combine, clean, enrich, and transform it.
- Predictive analytics: Forecast trends and future performance.
- Real-time analytics: Stream reports and analysis live.
- Instant insights with AI: TIBCO’s artificial intelligence engine identifies relationships in data and instantly recommends visualisations for lightning-fast insights.
The biggest drawback with TIBCO Spotfire is a lack of documentation for the cloud version of the platform. This feels like a strange oversight, considering how well the software is designed and relatively easy-to-use the platform is compared to most alternatives at this level.
An extensive library of online documentation - user guides, how-tos, troubleshooting, FAQs, etc. - would solidify TIBCO Spotfire’s status as the best analytics tool for non-data scientists.
Looker
Looker is a 100% browser-based data discovery platform that integrates with any SQL database or data warehouse. This infrastructure means Looker is significantly faster to set up than local BI platforms that rely on desktop apps and, potentially, on-site servers.
Looker also has its own proprietary data modelling language, called LookML, which will make life easier for users with little or no experience of working with SQL databases.
Key features:
- Modern BI & Analytics: Serve up real-time dashboards for more in-depth analysis. Easy access to trustworthy data enables fresh results for better reporting.
- Integrated Insights: Enhance the tools you’re already using by infusing new, relevant data. Unify and empower your teams to make more effective, data-informed decisions.
- Data-driven Workflows: Super-charge operational workflows with complete, near-real-time data. Save time and money by putting your data to work in every part of your business.
- Custom Applications: Provide a purpose-built tool that users need, while creating data experiences that people love.
- Looker Blocks®: Reuse the work others have already done rather than starting from scratch, then customize the blocks to your exact specifications.
- Looker Actions: Create data-driven automation workflows between your favourite apps.
Aside from its own modelling language, Looker also packs a number of innovative features into its platform. Looker Blocks allow users to save code snippets as blocks for others to reuse, which cuts out any unnecessary repetition. Then you’ve got Looker Actions that provide Zapier-like automation between your most important apps.
Yellowfin
Yellowfin is a truly modern analytics and business intelligence platform that delivers both powerful features and excellent UX. Where most enterprise analytics and BI systems are a bit of a let-down when it comes to design, Yellowfin feels like the kind of platform you would expect to be using in 2026.
The company’s aim is to make BI content creation, delivery and consumption as easy as possible for as many users as possible - and you can sense this while using the platform.
Key features:
- Dashboards: Create AI-powered dashboards to monitor, analyse and make better decisions.
- Action Buttons: Take direct action within the dashboard and close the loop in decision-making.
- Assisted Insights: Ask Yellowfin questions and its AI technology will analyse your data to find the answer for you.
- Yellowfin Signals: Immediately see what your dashboards can’t find.
- Data Discovery: Visualize and share with industry-leading collaboration tools. Findings can be shared to many workflows and reused in Dashboards, Stories, and Storyboards.
- Data Storytelling: author data stories and presentations that give your data a voice while generating common, consistent understanding across your organisation.
- Data Prep: Prepare your data for analysis with built-in tools.
Yellowfin operates on a no-code/low-code infrastructure, allowing users to switch between visual and code modes when creating visualisations. Not only is this great for non-coders but it also saves a bunch of time for those used to creating visuals from scratch.
You can also add Action Buttons to dashboards, allowing users to take specified actions based on reports - for example, navigating to specific sub tabs, resetting dashboards or filters, jumping to a report or even an external link.
Take your analytics to the next level
If you’re looking to take your analytics game to the next level, the platforms we’ve covered in this article will help you get there. Each tool has its own strengths and weaknesses but these are the best analytics and business intelligence in the game right now - so these will help you narrow down your list of options.
If you feel any platforms are missing from this article, feel free to make any suggestions and let me know why you think they should be included.
FAQ
What is the main difference between analytics and business intelligence platforms?
Analytics platforms focus on collecting and reporting historical data, whilst business intelligence platforms enable predictive analysis and strategic decision-making by combining data from multiple sources. BI platforms go beyond reporting to help organisations identify trends, forecast outcomes, and optimise operations based on actionable insights.
Which business intelligence platform is best for small businesses?
Microsoft Power BI offers the best balance of affordability and functionality for small businesses, with pricing starting at just £8 per user monthly. Its integration with Microsoft 365 and Excel makes it accessible for teams already using Microsoft tools, reducing implementation complexity and training time.
What should you look for in a BI platform?
The most important factors are ease of use, data integration capabilities, and scalability to grow with your organisation. You should also evaluate visualisation quality, real-time reporting features, and whether the platform supports your specific data sources and business requirements.
Is Google Analytics enough for business intelligence?
Google Analytics is excellent for website traffic analysis, but it’s not a complete business intelligence solution. True BI platforms like Tableau and Power BI integrate data from multiple sources across your entire organisation, enabling cross-departmental insights that Google Analytics alone cannot provide.
What data analysis and business intelligence brands are known for usability?
Tableau and Microsoft Power BI are recognised as industry leaders for user-friendly interfaces that don’t require extensive technical expertise. Tableau’s drag-and-drop visualisation tools and Power BI’s Excel-like familiarity make them the preferred choices for organisations prioritising accessibility across non-technical users.
Can business intelligence platforms handle big data?
Yes, enterprise BI platforms like Oracle Analytics Cloud and Qlik are specifically designed to process and analyse large datasets efficiently. These platforms use advanced data processing engines to handle millions of records whilst maintaining fast query performance and real-time reporting capabilities.
How much does a business intelligence platform cost?
BI platform costs vary significantly based on features and scale, ranging from £8 per user monthly for Power BI to enterprise pricing for Oracle Analytics Cloud. Most platforms use per-user or per-organisation pricing models, with additional costs for data storage, advanced features, and implementation support.