


“If you can’t measure it, you can’t improve it.”
That adage,incorrectly attributed to revolutionary management mind Peter Drucker, is a guiding principle for successful marketers.
In today’s competitive business landscape, it’s critical to make your marketing budget count.
That means experimenting with campaigns, identifying your high performers and optimising them for maximum ROI.
But how do you identify high-performing campaigns? And how do you improve them for the biggest benefit?
It all starts with measurement, and this guide has that covered with 51 critical marketing metrics:
- 3 Sales & Revenue Metrics
- 12 Lead Generation Metrics
- 10 Content Consumption Metrics
- 4 Organic Search & SEO Metrics
- 4 Social Media Marketing Metrics
- 8 Email Marketing Metrics
- 6 Customer Retention Metrics
- 2 Brand Awareness Metrics
Before we dive deep into the full list, let’s take a surface-level look at the two main types of marketing metrics.
2 Main Types of Marketing Metrics
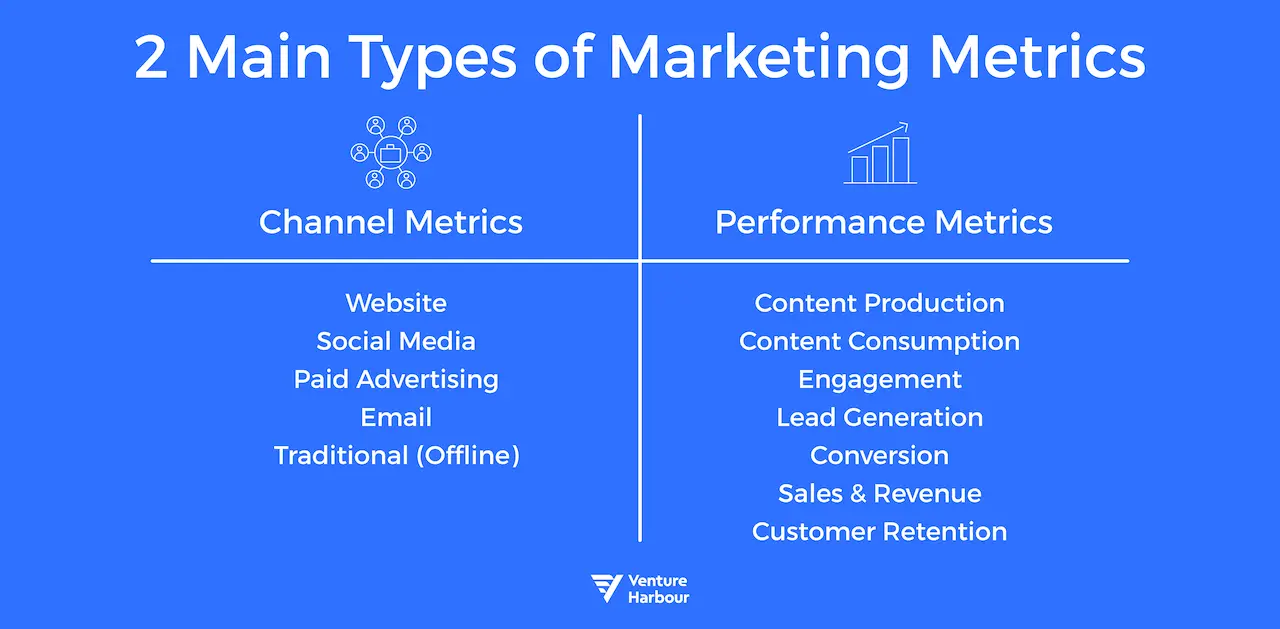
There’s a ton of overlap between the many marketing metrics your company can track, but they can be grouped into two general categories:
- Channel metrics
- Performance metrics
1. Channel metrics
Channel metrics refer to the platform or medium you’re measuring and can be broken down with varying degrees of granularity. Thinking most broadly, here are some examples of common marketing channels with examples of more specific sub-channels:
- Website: Organic search, PPC search, referrals and direct
- Social Media: YouTube, Facebook, Twitter, Instagram, Pinterest, LinkedIn and TikTok
- Paid Advertising: Social media ads, influencer marketing, PPC search, banner ads and retargeting
- Email: Weekly newsletters, exit-intent coupon sequences and abandoned cart sequences
- Traditional (Offline): Direct mail, TV and radio ads, billboards and general word-of-mouth
If you ask 10 different marketers how they organise the wide range of marketing channels, you’ll probably get 10 different answers.
That’s because there’s no single best way to do it.
Think about PPC search traffic. That’s a specific sub-channel of website traffic, right? Or does it belong with social media and banner ads in the larger Paid Advertising bucket?
Both answers are correct. The way you think about your marketing channels is specific to your business, and you don’t even need to categorise PPC search in just one place.
2. Performance metrics
Performance metrics refer to the results you’re achieving. Common types of performance metrics include the following with a few examples of each:
- Content Production: Number of articles published and number of social media posts
- Content Consumption: Website traffic volume and average time on page
- Engagement: Comments and shares on Facebook posts
- Lead Generation: Marketing qualified leads (MQL) and sales qualified leads (SQL)
- Conversion: Landing page conversion rate, search click-through rate (CTR) and form completion rate
- Sales & Revenue: Total revenue, number of sales and customer lifetime value (CLTV)
- Customer Retention: Newsletter unsubscribe rate
- Brand Awareness: Branded organic search volume
Each of these performance metrics is vital to understanding the success of your marketing efforts, but they’re just vanity metrics when used on their own.
- “We had 55,000 organic search visitors.”
- “Our hashtag #RandomCompanyRocks was used 27 times.”
- “Our landing page converted 2.5% of its traffic into sales.”
Reading those stats alone, I’m not sure whether to fire or promote you. That’s because they need a little context.
Make Your Metrics Actionable With Context
You don’t track a whole bunch of marketing metrics just to create busy, colourful dashboards to wow your coworkers. You track them because you want to use that data to grow your business.
Marketers who invest in measuring and managing performance create more value, achieving 5% better returns on marketing investments and over 7% higher levels of growth performance.
Source:2017 Forbes Marketing Accountability Report
There are two key actions in that sentence:
- Measuring
- Managing
Measuring performance is the primary focus of this guide, but measuring alone is useless if you aren’t also managing performance.
And to manage performance, you need to contextualise your metrics and pair them with goals.
Contextualise your metrics with time, market and industry
You’re out for lunch with a colleague who works for a company that sells tiny top hats for dogs. Apparently, it’s the latest craze, and the tiny top hat industry is booming.
Your colleague is responsible for designing and optimising his company’s landing page. You ask how work is going and he replies, “Well, the landing page has a 2.5% conversion rate.”
Umm…good work?
Without additional context, it’s virtually impossible to derive anything meaningful from that 2.5% conversion rate.
Let’s add meaning with these three forms of context:
- Time
- Market & Competition
- Industry
1. Time
Your business’s performance can be evaluated in three time periods, and each answers a different business question.
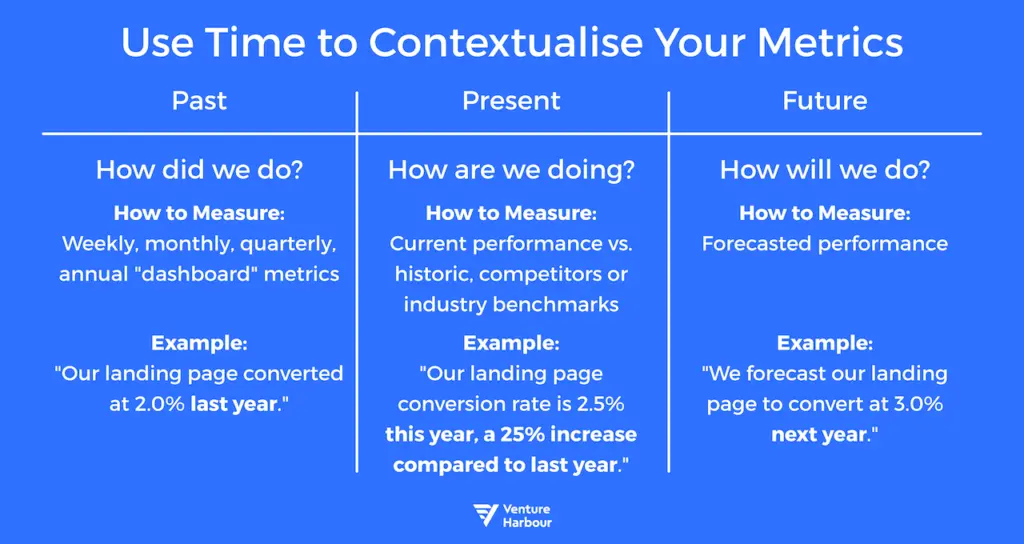
Let’s revisit your colleague’s landing page and add some context:
- Past: “Our landing page converted at 2.0% last year.”
- Present: “Our landing page conversion rate is 2.5% this year, a 25% increase compared to last year.”
- Future: “We forecast our landing page to convert at 3.0% next year.”
Now you have a better idea of how he’s doing, but it still isn’t crystal clear because you lack two additional pieces of context.
2. Market & Competition
Businesses don’t exist in silos. Your company probably has competitors, and those competitors are trying to beat you. That’s why comparing your performance to your competitors’ performance is crucial.
Unfortunately, knowing how well your competitors are performing can be challenging. Some metrics are readily available (Facebook page likes), others can be estimated using online tools and databases (organic search traffic), and a frustrating many are kept private (conversion rates).
But even if you aren’t privy to your competitors’ metrics, sometimes you can estimate them to provide a little extra context.
In your colleague’s instance, he can estimate his competitors’ landing page conversion rates byunderstanding the relationship between conversion rate and available page performance data like bounce rate.
His improved reply: “Our landing page is converting at 2.5% this year compared to last year. Our top competitor’s landing page has a higher bounce rate, so I think their conversion rate is around 2.2%.”
But there’s still one last piece of context missing.
3. Industry
Beyond your market and competition, you can also look at industry-wide benchmarks to contextualise your performance.
For things like landing pages, there are tons ofbenchmarking studies andreports for you to compare your performance against. And if your company sells a product or service to a specific geographic region, you can compare yourself against companies from the same industry in other geographic areas.
Let’s improve your colleague’s reply with this final piece of context: “Our landing page is converting at 2.5% this year compared to last year. Our top competitor’s landing page has a higher bounce rate, so I think their conversion rate is around 2.2%. The industry average conversion rate is 3.0%, so I still have some work to do.”
Now, that’s a highly contextualised reply you can immediately understand.
Pair Your Marketing Metrics with SMART Goals
You’ve probably heard ofSMART goals before. If not, here’s your crash course.
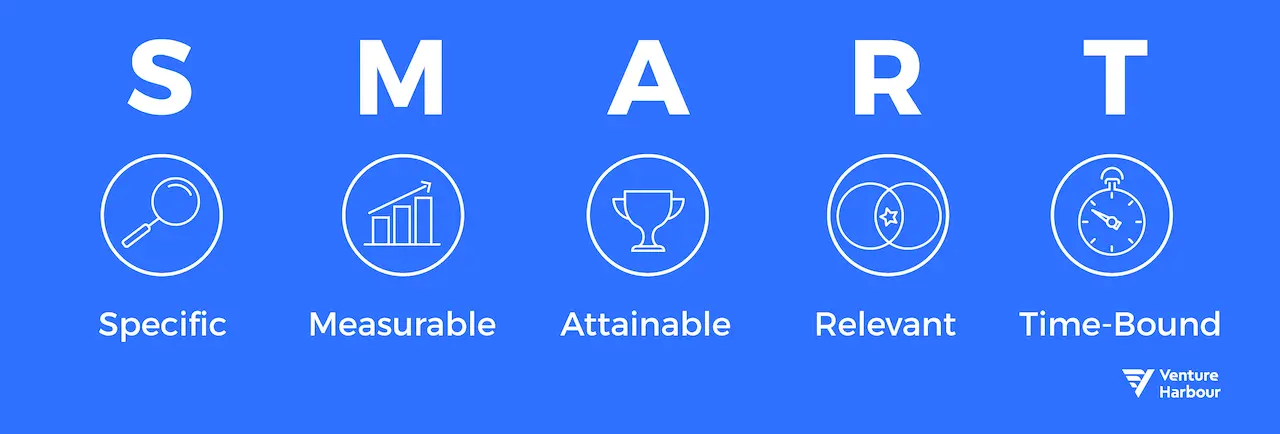
SMART is an acronym to help you remember the five key criteria of an effective goal.
- Specific: Be detailed and clear about what you want to achieve.
- Measurable: Identify the metric(s) you’ll use to evaluate success.
- Attainable: Make sure the goal is realistic.
- Relevant: Align the goal with identified business objectives.
- Time-Bound: Give yourself a defined window in which to achieve the goal.
If you pick any single marketing metric from this list, you can easily check off S, M, A and T. Let’s use a commonly-measured marketing metric: social media following.
- Specific: We want to increase our Facebook page’s likes by 20%.
- Measurable: We’re going to measure our Facebook page’s likes using Facebook’s Insights tools.
- Attainable: We’ve seen similar brands achieve similar results.
- Time-Bound: We want to achieve our goal in three months.
That all sounds good, but it’s missing one key element: the “why.”
Why do you want to increase your Facebook page’s likes? How does that connect to your business’s marketing plan? Why are Facebook page likes relevant?
Tie metrics to business objectives to make them relevant
One of the most common traps marketers fall into is focusing on descriptive vanity metrics that aren’t tied to tangible business objectives (the results you’re trying to achieve).
A 20% increase in Facebook page likes over the next three months is great, but you still need to articulate why that will help your business grow by tying it to an identified business objective.
Let’s bring back your colleague’s company that makes tiny top hats for dogs. One of their identified business objectives is to increase sales volume by 50% over the next year. Their product sales come through a landing page, and one of their tactics to drive traffic to that landing page is by referring their Facebook followers. By increasing their Facebook page’s likes, they have access to a larger audience they can drive to that landing page to convert into sales.
Let’s complete the SMART goal above to include this identified business objective:
- Specific: We want to increase our Facebook page’s likes by 20%.
- Measurable: We’re going to measure our Facebook page’s likes using Facebook’s Insights tools.
- Attainable: We’ve seen similar brands achieve similar results.
- Relevant: We want to increase product sales by 50% in the next 12 months. Sales are generated from our landing page, and Facebook is one of our top channels driving traffic to that page.
- Time-Bound: We want to achieve our goal of increasing Facebook page likes in three months.
*Oh, and we should create another SMART goal for what “post shareable content more regularly” actually means.
51 Critical Marketing Metrics
The specific marketing metrics you track are highly dependent upon your company’s product, business model, industry and a host of other factors. Whether you’re an established brand with a few go-to metrics already identified or a startup with a clean slate, you’re sure to find something useful on this list of 51 crucial marketing metrics.
Sales & Revenue Metrics
The primary objective of most businesses is to increase sales and revenue. These are the top-level metrics you’ll need to track your performance.
1. Incremental Sales
Incremental sales measure the efficacy of your marketing efforts by tracking the net change in sales volume over a period of time. It requires knowing two things:
- Sales volume during the period you’re measuring
- Sales volume during a baseline period
Let’s look at two use cases.
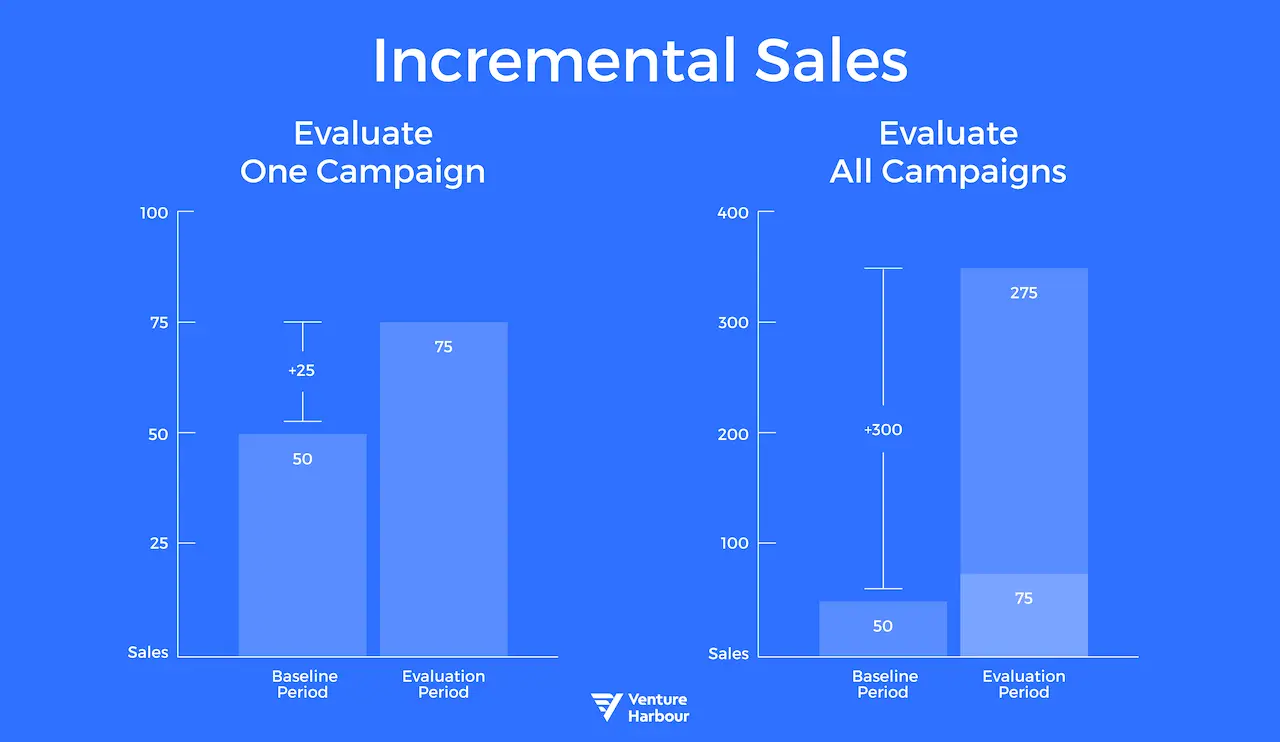
Use Case 1
You want to evaluate the impact of a layout change for a holiday marketing email you send to your subscribers each year.
Last year you sent your email to 5,000 subscribers and generated 50 sales. This year your list is still at 5,000. You send your revised annual email, generate 75 sales and put “get more email subscribers” on your to-do list. The net change is 25 incremental sales (75 - 50) generated from the same 5,000 sent emails. You feel confident your layout change worked.
Use Case 2
In addition to measuring the success of a specific campaign, you can also use incremental sales to measure the success of all marketing efforts in the aggregate. Let’s use the same business from Use Case 1.
Your business sold 1,000 units of product in Q4 last year. Your goal is to increase your sales volume by 25% year-over-year using several tactics, including your revised holiday email and by creating your business’s first social media account. That 25% growth equates to 250 incremental sales over Q4 last year (1,000 x 25%), which is your baseline period.
We already know your revised holiday email generated 25 incremental sales. You also observed your social media efforts lead to 275 sales, all of which are incremental because your baseline period (Q4 last year) was zero.
Combining those two campaigns, you generated 300 incremental sales (25 + 275), which is more than your target of 250. Excellent work, marketing guru.
2. Incremental Revenue
Just like incremental sales, you can also measure incremental revenue. The approach is the same, but incremental revenue is a more bottom-line metric because it focuses on actual dollars.
Using the example above, let’s say your company sells its product for $100. Your holiday email redesign generated 50 incremental sales at $100 per sale, generating $5,000 in incremental revenue. You hired a designer for $1,000 to make your email more eye-catching, and that $1,000 investment led to $5,000 of incremental revenue.
But what if you didn’t change your email’s design and instead raised your price from $100 to $125? You send the email to those 5,000 people and generate 45 sales, which is $5,625 of total revenue and $625 of incremental revenue compared to last year ($5,625 - $5,000) despite -4 incremental sales.
(Yes, incremental totals can be negative.)
3. Customer Lifetime Value (CLTV)
CLTV tells you how much value the average customer generates for your business.
But “value” is an intentionally vague word because you can measure CLTV with either gross revenue or net revenue after expenses (not including marketing). Including expenses gives you a better idea of value and business performance but is more complex.
Speaking of complex, there are a lot of factors that impact your CLTV:
- Payment model (one-time vs subscription)
- Product price point(s)
- Purchase frequency
- Upsell offers
- Returns and refunds
- Cost of goods sold (COGS)
- Other operational expenses (not including marketing)
The easiest way to calculate your business’s customer lifetime value is to begin with a narrower scope, such as customer annual value, and then multiply the annual value by the number of years you expect to retain your average customer, also called your average customer lifespan (ACL).
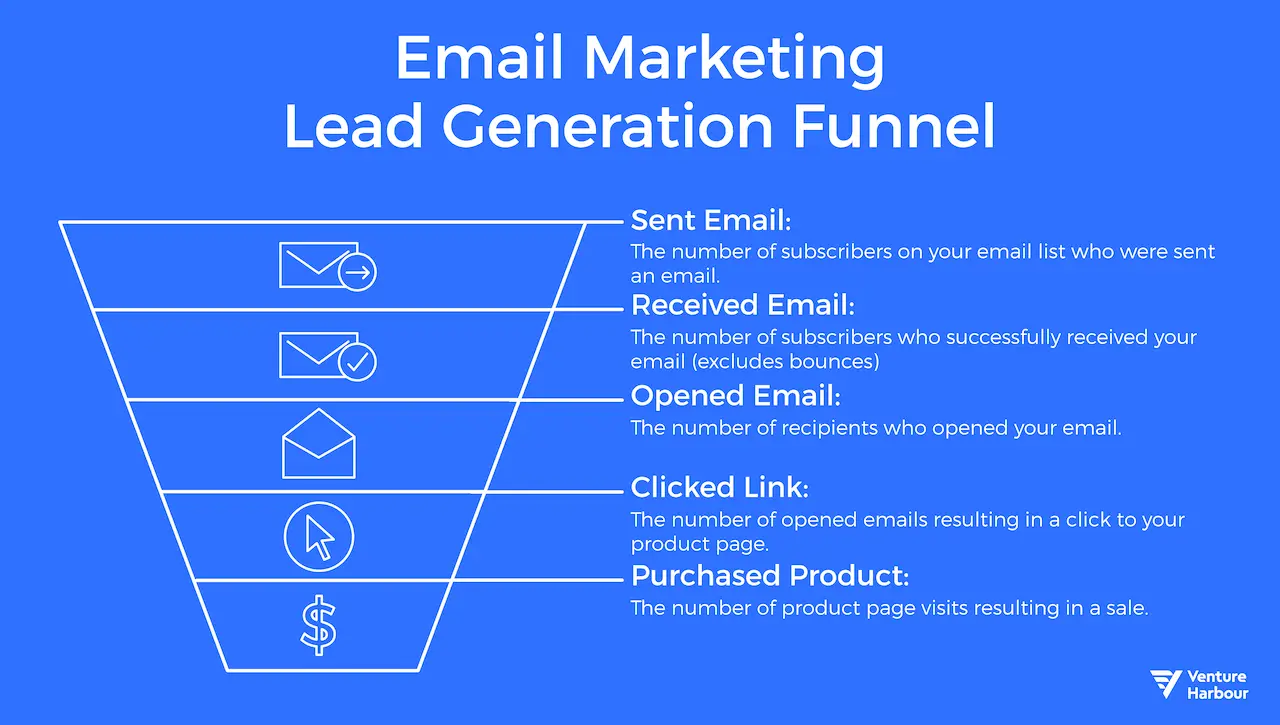
Lead Generation Metrics
Leads are the lifeblood of your business. They can be found through any channel, and the exact ways you measure lead generation will vary by channel. Still, these are the most critical, high-level lead generation metrics to track with paid advertising efforts included.
4. Clickthrough Rate (CTR)
CTR tells you the rate at which users click on links, buttons or any other on-page elements. It’s measured as (Number of Clicks) / (Number of Impressions) and is a widespread metric used pretty much everywhere in marketing to measure various conversion rates:
- PPC & Organic Search: Click rate on search results
- Social Media: Click rate on video thumbnails in YouTube search results
- Email Marketing: Click rate on links in emails
Though CTR could be categorised in numerous other places in this guide, it winds up in the Lead Generation section because you measure it to increase the number of people you lead to a target outcome.
Of the many available marketing metrics, CTR is one of the most important to compare to industry benchmarks. A lot of research exists on optimising CTR, because clicks lead to conversions regardless of whether you’re talking aboutPPC oremail.
5. Conversion Rate
Like CTR, conversion rate is another ubiquitous marketing metric. At its simplest, conversion rate measures the rate at which users complete an action. Here are some common examples of conversion rates marketers measure:
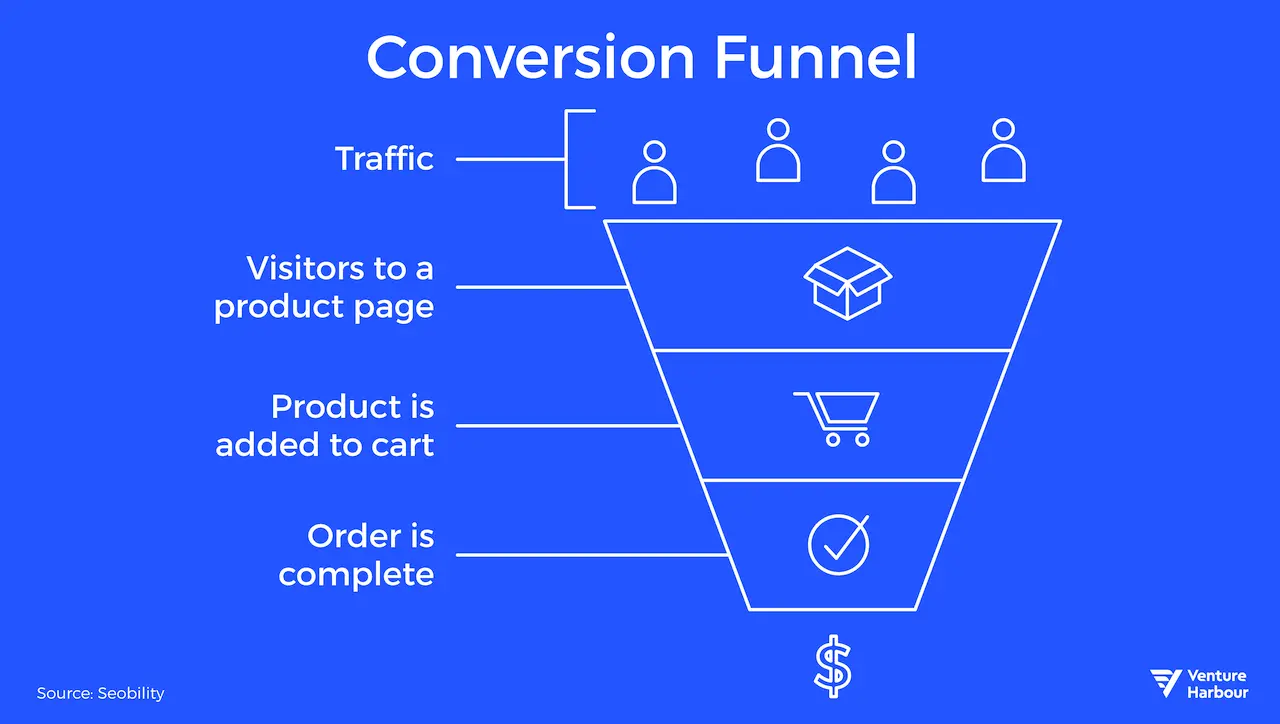
- Sales Funnels: Users moving through subsequent stages
- Email Marketing: Website traffic subscribing to an email list
- Landing Pages: Landing page traffic purchasing a product
Conversion rate is such a fundamentally important metric because it can make or break a business.
Take PPC ad campaigns, for example. They can be great ways to drive targeted traffic to specific product or landing pages. You pay for each click to your page and now that traffic is yours to convert.
Imagine you have two landing pages promoting the same offer that you’re A/B testing to see which converts better: Landing Page A and Landing Page B. Your PPC ad campaign costs $1 per click, and you drive 1,000 clicks to each landing page promoting a $100 product with a $35 margin.
- Landing Page A has a 2.5% conversion rate and generates 25 sales ($875 margin)
- Landing Page B has a 3.5% conversion rate and generates 35 sales ($1,225 margin)
It costs the same to drive 1,000 clicks to each page ($1,000) and both pages promote the same $100 product with a $35 margin, but Landing Page A lost money (-12.5% ROI) while Landing Page B made money (22.5% ROI).
Many marketers focus on increasing sales, revenue, email subscriptions and other metrics by investing in more traffic when a more affordable (and sometimes more effective) strategy is to optimise the traffic you already have.
Or, you know, do both.
6. Qualified Leads
A qualified lead is someone who could become a potential customer. There are three types of qualified leads, which are categorised based on the information they’ve provided or how they’ve interacted with your sales funnel:
- Information Qualified Lead (IQL): Early in the funnel and have only given basic information like their name or email address.
- Marketing Qualified Lead (MQL): Middle of the funnel and have continued to express interest or interact with your content.
- Sales Qualified Lead (SQL): Bottom of the funnel and have expressed interest in purchasing.
IQLs are cold leads, MQLs are warm leads and SQLs are hot leads. Many marketers keep an eye on the ratio of these three types of leads and the conversion rates between them (how many MQLs become SQLs, for example).
7. Cost Per Click (CPC)
CPC is the amount you pay for each click on an element, usually a link, and is commonly found in PPC ad campaigns. However, you can also measure CPC for things like email marketing campaigns.
Let’s say it costs $500 each month to communicate with your email list. You send a weekly email to your 2,000 subscribers for a total of 8,000 sent emails each month, which generates 500 total clicks on links in those emails. It costs you $500 to generate those 500 clicks for a $1 CPC. If you can improve your open rate or your click-through rate, you can get more clicks for your $500 spend and drive your CPC down.
8. Cost Per Thousand Impressions (CPM)
CPM is similar to CPC but uses impressions instead of clicks in the denominator. It’s commonly used for display ads where you pay a set rate for every 1,000 impressions (views) of your display ad.
9. Cost Per Lead (CPL)
CPL assesses how effectively your marketing campaign turns dollars into leads and is measured by (Campaign Spend) / (Number of Leads). Leads can be measured in either IQL, MQL or SQL depending on your business needs, but SQL are the most qualified, ready-to-buy leads and will correlate strongest with incremental sales and revenue.
10. Customer Acquisition Cost (CAC)
CAC takes CPL one step further by looking at how much it costs to generate one new paying customer. It’s measured in the same way, except the denominator has changed: (Campaign Spend) / (Number of New Customers).
Above, we looked at Customer Lifetime Value (CLTV), which is the total value a customer is expected to generate for your business. Keep an eye on you CAC and CLTV, especially the ratio between the two, to make sure it isn’t costing more to acquire new customers than they’ll generate for your business. For this comparison, make sure you calculate CLTV including all expenses except marketing costs.
11. Lead Generation Rate
The rate at which you convert traffic into leads. It’s a form of conversion rate where the conversion you’re measuring is new leads instead of something like email sign-ups.
12. Lead-to-Customer Ratio
The rate at which you convert leads into customers. It’s also a form of conversion rate calculated as (New Customers) / (Number of Leads). You can use any of IQL, MQL or SQL in the denominator.
13. Lead Score
A numeric value assigned to each lead based on information they provide, such as their age, sex, geographic location, online behaviours or interests. Your exact scoring method should be unique to your business with values tied to known indicators of lead quality. It’s a great way to quickly identify high-value leads and monitor the overall quality of your lead pool over time.
14. Time to Conversion
How long it takes for leads to convert. Conversions may be sales, email sign-ups or anything else of value for your business.
15. Abandonment Rate
The rate at which users begin an action and abandon before completion. It’s frequently seen with shopping carts and forms. High abandonment rates signal poorly-designed elements in need of attention.
Content Consumption Metrics
Content consumption includes content on any channel, running the gamut from blog posts to YouTube videos. For the most part, the metrics in this section are website-focused with channel-specific metrics in subsequent sections.
Note: All of these content consumption metrics can (and should) be evaluated by channel so you can measure the performance of organic search, PPC search, social media, referral and other traffic sources to determine which channel sends the highest-quality traffic.
16. Website Users
There are three types of volume metrics for website traffic:
- Users: Unique people who visit your site
- Sessions: Total number of visits to your site including repeat sessions by visitors
- Pageviews: Total number of pages viewed on your site across all sessions
Users is an important metric to track because it’s the number of unique people consuming your website’s content. It’s especially important because you can segment it into new and returning users, giving you insight into how both types of users interact with your site and allowing you to optimise for your business objectives.
17. Website Sessions
Sessions counts every visit to your website, including repeat visits. It’s great to use as a denominator in many of your conversion rate metrics when evaluating how effective your website is at converting your traffic into product sales, demo requests or email sign-ups.
In general, more sessions means more opportunities to generate conversions, whether that’s product sales, demos, email sign-ups or something else, but sessions alone can be misleading. Unless you’re monetising your traffic with display ads, traffic itself is worthless. It’s the actions that traffic takes that have value.
Let’s say your company developed an innovative marketing campaign management tool likeTrueNorth. You’re using a content marketing campaign to generate leads with a demo request CTA at the bottom of each page. Consider two articles you published six months ago:
- Article A is a roundup of 10 helpful Internet resources for marketing campaign managers. It drives 1,000 sessions per month and generates 40 demo requests.
- Article B is an in-depth tutorial showing your product’s functionality. It drives 200 sessions per month and generates 80 demo requests.
Article A drove five times as many sessions, but Article B generated twice as many qualified leads. Which has more value for your business?
18. Website Pageviews
Pageviews is the total number of pages across all sessions and frequently is reported as pageviews per session, which is an important metric to evaluate website engagement.
But remember to keep your content’s purpose in mind. While a high pageview per session metric can indicate high engagement, it can also indicate your users are struggling to find what they’re looking for. That’s why you should always evaluate page-level performance in the context of the following additional metrics.
19. Time on Page
Time on page measures the length of time visitors spend on a single page before leaving that page. While more time on page generally is good, evaluate it in the context of that page’s purpose and other metrics in this section.
If your 5,000-word, in-depth guide has an average time on page of just 25 seconds, there’s probably something wrong with the page. If the content is great, experiment with different formats.
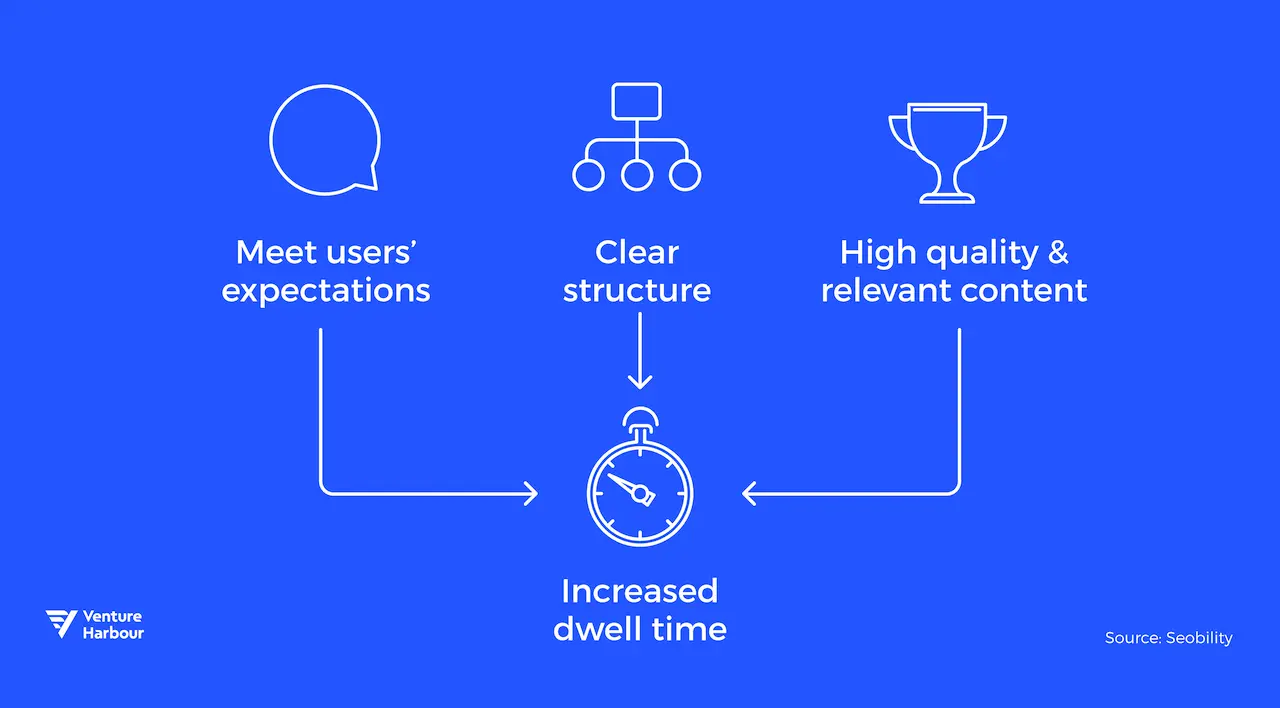
Dwell time is a related metric to time on page with a narrower focus: It only looks at pages where a user clicked on a search result, visited your page, and then went back to the search results
Time on page is more inclusive and looks at how long a user spent on a page regardless of where they came from or where they went after.
20. Bounce Rate
Bounce rate is the percentage of people who visited your site and left without taking an action. High bounce rates are universally bad in theory. What’s the value of someone finding your site and leaving without doing anything? The problem is the way bounce rate is measured by tools like Google Analytics.
By default, Google Analytics records a 100% bounce rate for any session that doesn’t result in a click to another page, but what if the goal of your content is something other than getting the user to visit more pages? If you want your user to play a video or interact with the page in some other way, you’ll need toconfigure event tracking to capture that interaction.
Page-level bounce rate, in combination with time on page, can help you identify your best and worst-performing content.
21. Exit Rate
Exit rate is the percentage of visitors to a page who exited your site from that page after having been referred from another page on your site. Put another way:
- Bounce: Visitor enters the page from an external source and leaves without visiting any other pages or interacting with the page in a way you’ve defined.
- Exit: Visitor enters the page from another page on your site and then leaves.
Exit rate is best evaluated at the page level with high exit rates usually signaling content that needs to be improved.
However, that isn’t always the case. Pages that say “thanks for subscribing” or “enjoy your purchase” often are meant to be exited, so consider a page’s purpose when evaluating its performance.
22. Average Session Duration
The average amount of time users spend consuming content on your site during a single session.
23. Scroll Depth
Scroll depth is available for Google Analyticsas a plugin and allows you to track how frequently users scroll to various depths on your page: 25%, 50%, 75% and 100%. If you have a CTA at the bottom of your page but no one scrolls that far, consider moving the CTA to the top or make other content/design changes to encourage more interaction.
24. Article Comments
We often think of engagement as a social media metric, but tracking article comment counts can be a useful website way to evaluate how well your content resonates with your audience. Plus, more comments gives your content more perceived authority and value.
25. Article Likes & Shares
Similarly, you can embed social media buttons on your content to encourage likes and shares, which is great for increasing your content’s perceived authority and reach.
Organic Search & SEO Marketing Metrics
Frequently, organic search is one of the most valuable channels for your business. Track your business’s content marketing efforts with these critical organic search and SEO marketing metrics.
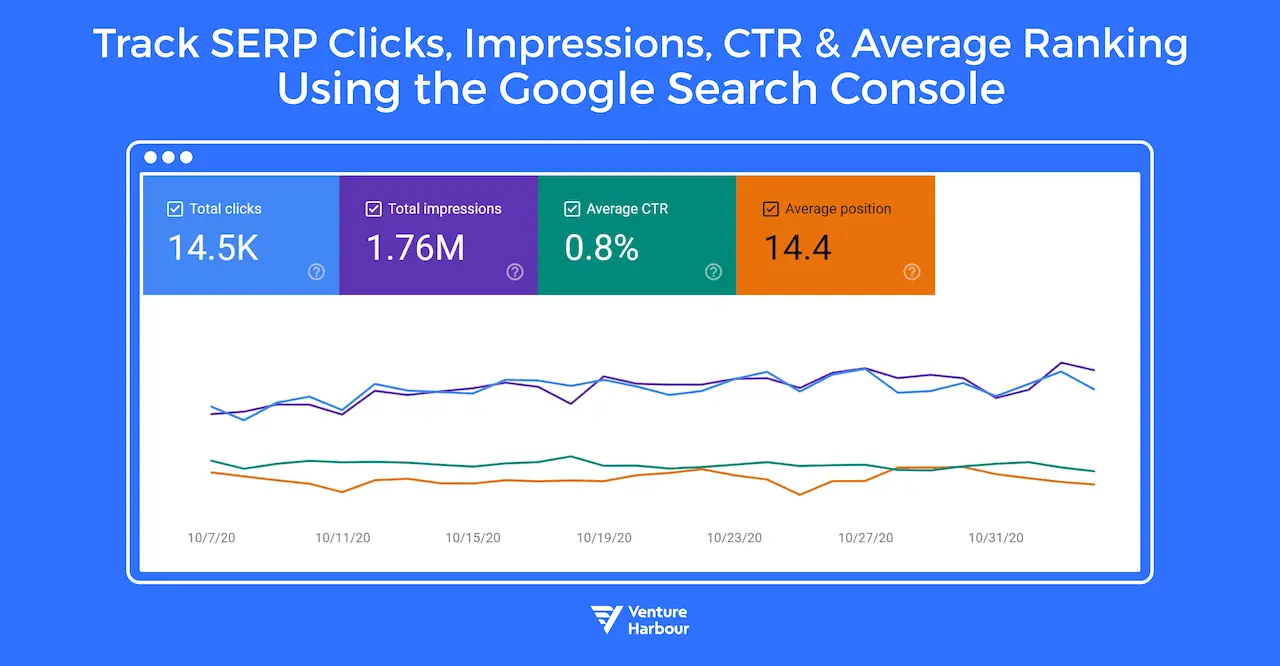
26. SERP Impressions
The Google Search Console is a goldmine of valuable data. One such metric is the number of impressions your pages have in the search engine results pages (SERPs). SERP impressions are important because no one can click on your pages if they don’t see them, which takes us to the next SEO marketing metric.
27. SERP Clickthrough Rate (CTR)
Also available in the Google Search Console is the SERP click-through rate for your pages. The Search Console lets you view your site’s performance by page or by query, so you can see how often people are clicking on your search results. This is an excellent way to identify pages with meta titles, descriptions and other SERP features in need of improvement.
28. Keyword Rankings
A third metric available in Search Console is your pages’ average rankings in the SERPs. It’s a great way to track how your content is performing for your target keywords over time as well as identify new keywords to optimise your pages for.
You can also track your site’s rankings for specific search phrases using keyword tracking tools like Ahrefs.
29. Featured Snippets
Google is always adding new SERP features to improve their user experience and achieve their own business objectives. One such feature is the featured snippet, which is a styled, top-ranking result containing an excerpt from one of the search results.
Not every query result returns a featured snippet, but it can be important to track those that do becauseusers interact differently with search results pages depending upon whether a featured snippet is present:
- No snippet: 26% of clicks go to the first result
- Snippet present: 8.6% of clicks go to the featured snippet and 19.6% go to the first result below the snippet
Pages selected for the snippet used to double-dip with both the snippet and a standard top 10 search ranking, but Googlechanged that in January 2020 by pushing pages featured in the snippet to page two.
While grabbing the featured snippet likely means alower SERP CTR compared to having a top-three ranking position, it’s better than being in positions 4-10.
Social Media Marketing Metrics
Platforms such as YouTube, Facebook, Twitter, Instagram, Pinterest, LinkedIn, TikTok and others represent great marketing opportunities for most businesses, but the specific platforms you use and how you leverage them varies. Regardless of whether you’re publishing instructional YouTube videos or shareable Facebook posts, these are the critical social media marketing metrics to track.
30. Audience Growth Rate
If social media is an important channel for your business, the size of your audience is a critical metric because a larger audience means more organic reach. Larger followings also lend social proof, which can have an indirect positive effect on your business.
But remember that “Facebook page likes” is a vanity metric that doesn’t tell you anything meaningful. It needs to be tied to other metrics (like the ones below) that connect your Facebook audience size with identified business objectives.
31. Post Reach
The definition of reach varies by platform but, generally, it’s either the number of unique people who see your content or the number of unique people who interact with it in some way. It is not the total number of times your content is seen (those are impressions, described below).
Reach also can be segmented into organic reach and paid reach.
- Organic reach correlates with the size of your audience. The larger your audience, the more people that content will reach, thoughorganic reach is falling.
- Paid reach is a form of paid advertising and gives you instant access to a target audience without having an audience of your own.
Like audience size, post reach is an oft-cited vanity metric that doesn’t tie directly to a business objective. Increasing your post reach is an important way to drive social media traffic to your business, but you need to be able to connect the dots from post reach to website visits to conversions.
32. Post Impressions
Impressions are the total number of times your content is seen. Impression counts are less valuable if you’re tracking how many conversions your posts generate because they don’t focus on unique users. However, impressions are very important for paid social campaigns because campaign cost usually is determined by how many impressions your ad has.
33. Engagement Rate
Engagement rate measures the frequency with which people actively consume your social media content. It varies by network but frequently includes the following actions:
- Likes and dislikes
- Comments
- Shares
- Video views
- Account likes, follows and subscriptions
Engagement rate is calculated as (Number of Interactions) / (Total Reach or Impressions). Both the numerator and denominator vary by network, but higher is always better.
Engagement rate offers a great opportunity to compare your performance against network-specific and niche-specificengagement benchmarks.
34. Amplification Rate
The ratio of a post’s shares to your total number of followers. It’s a great way to understand how often your audience is actively promoting your content for organic, viral growth.
35. Clickthrough Rate (CTR)
The rate at which your social media content drives clicks to your target page, usually measured as either (Number of Clicks) / (Reach) or (Number of Clicks) / (Number of Engagements).
Email Marketing Metrics
Email marketing is capable of generating insane ROIs withsome studies putting average returns at 38x. Maximise your business’s email campaigns by tracking these critical email marketing metrics.
36. List Growth Rate
Many marketers view growing their email list as a mission-critical objective. That makes both measuring your list’s growth over time and setting SMART goals for subscriber counts important activities.
37. Open Rate
Open rate is the percentage of sent emails which are opened by their recipients. It’s one of two critical rate metrics (along with the CTR) that can make or break your email campaign’s ROI. After all, you can’t get people to click on links if they don’t even open your emails.
Low open rates mean you may need to make your subject lines more irresistible or work on providing better value to your subscribers so they look forward to seeing your emails.
Email open rate can be a misleading metric, though. Whether an email is marked as “opened” depends on whether the tracking pixel in the email was loaded. Unfortunately, some email clients block images and thus don’t load the pixel even if the email was opened. That makes open rate better as a comparative metric as you look to improve your open rates from campaign to campaign.
38. Clickthrough Rate (CTR)
Once opened, your goal is to get your subscribers to click on your links (if applicable). As seen elsewhere, CTR measures link click frequency and can be either the number of unique recipients who clicked on a specific link or the number of unique recipients who clicked on any link (if there’s more than one).
CTR is the most important email marketing performance metric and is crucial to track if you’re serious about your email list. It’s also a simple but great way to split test email copy.
39. Bounce Rate
Bounce rate is the percentage of emails that could not be delivered successfully and there are two types of bounces:
- Hard Bounces: Couldn’t be delivered due to a permanent issue, such as a non-existent email address
- Soft Bounces: Couldn’t be delivered due to a temporary issue, such as a full inbox
Bounce rate doesn’t have a negative business-level impact unless you have a bunch of invalid email addresses on your list driving up your list maintenance costs. However, high bounce rates can get your email address flagged as spam, and that can hurt your deliverability rates across the board.
40. Conversion Rate
The rate at which your emails turn into conversions. It skips the middleman metrics (opens and clicks) and is calculated as (Conversions) / (Total Emails Sent).
41. Forward Rate
The rate at which email recipients forward the emails they receive.
42. Spam Complaints
The number of email recipients who flag your email as spam. This can hurt deliverability.
43. List Unsubscribe Rate
The rate at which people unsubscribe from your email list. High unsubscribe rates may indicate you aren’t matching your email content to your subscribers’ needs and/or your email list is full of low-quality targets.
Customer Retention Metrics
Acquiring a new customer is up to25x more expensive than retaining an existing one, which makes it especially important for you to track these customer retention metrics.
44. Net Promoter Score (NPS)
NPS measures customer loyalty by asking your customers one question: On a scale of 1-10, how likely is it that you would recommend this company to a friend or colleague?
Respondents are grouped into one of three categories based on their reply:
- Promoters (9-10)
- Passives (7-8)
- Detractors (0-6)
NPS doesn’t directly measure retention, but it does measure brand sentiment to give you an idea of whether your customers would do business with you again.
45. New vs Returning Visitors
New vs returning visitors is a traffic segment available in reporting tools like Google Analytics. It lets you look at how many visitors return to your site during a specified time.
46. Average Customer Lifespan (ACL)
ACL is the average amount of time between the first and last purchase your customers make. It’s a key component of measuring your customer lifetime value (CLTV) and indicates how much staying power your brand has with customers, including how successful your email marketing efforts are at nurturing repeat sales.
47. Repeat Purchase Rate (RPR)
RPR is the percentage of customers who return to purchase from your business again. It’s a great indicator of customer loyalty because it’s simple, easy to understand and directly ties to common business objectives like increased sales and revenue. When combined with customer demographics and the channel through which they first found you, RPR lets you make several key insights into your business.
48. Product Return Rate
Product return rate is the percentage of ordered products which are returned. You’ll never be able to eliminate product returns entirely, but excessive returns signal a problem either in the sales funnel or with the product itself.
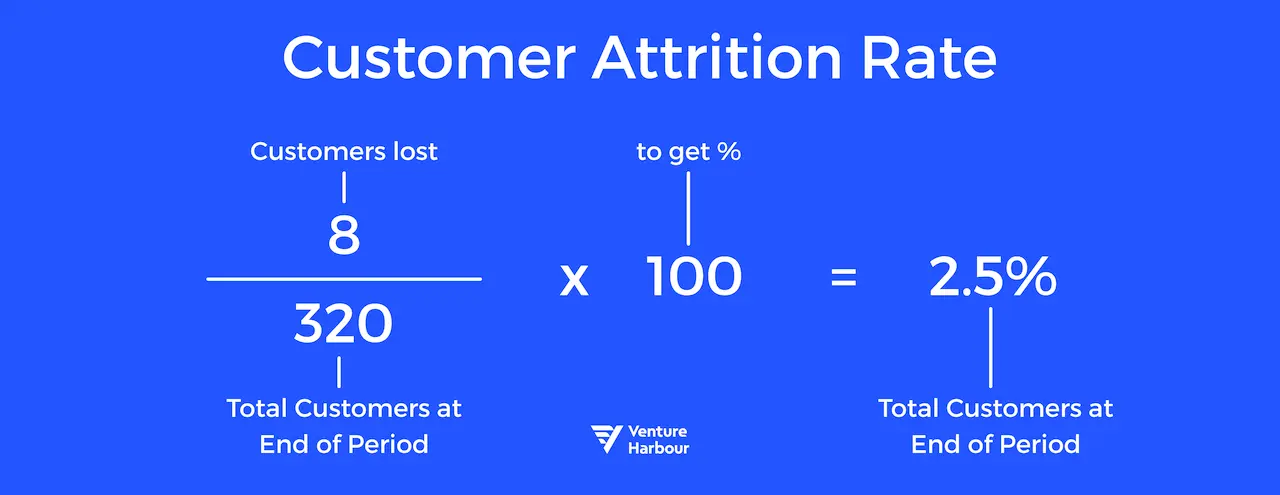
49. Customer Attrition Rate
Customer attrition rate is the rate at which customers cease doing business with you. Every business experiences some degree of customer attrition, but it’s important to monitor your attrition to make sure you aren’t losing existing customers faster than you’re acquiring new ones.
Also called customer churn rate, it’s calculated over a defined period of time as (Number of Customers Lost) / (Total Customers at End of Period).
For some businesses, knowing the number of customers lost is simple. If you sell a subscription, it’s easy to see when people cancel their subscription.
But for most businesses, knowing the number of customers lost is more challenging or even impossible. If you sell a physical product like a book or a chair, how do you know when you lost a previous customer?
For these businesses, a modified version of customer attrition rate can be used that measures the net change to your customer base over time: [(Customers in Current Period) - (Customers in Prior Period)] / (Customers in Prior Period).
An example: Last month you sold your product to 50 unique customers. This month you sold your product to 60 unique customers. Your attrition rate is (50 - 60) / 50 = -20%.
Yes, because you gained customers this month, your attrition rate is negative.
Also note that “unique customers” means unique during each time period. If Dan made two transactions in the current month, he’s only counted once for that month. If Dan makes one transaction in both periods, he’s counted in both.
Brand Awareness Metrics
Measuring and ascribing ROI to brand awareness campaigns can be challenging, but there are a few key ways you can track your performance.
50. Social Media Brand & Hashtag Mentions
Tracking mentions of your brand on social media is an easy way to gauge awareness. Branded hashtag campaigns like #RandomCompanyRocks are a great way to build awareness and you can measure uses of those hashtags by other accounts over time.
51. Branded Search Volume
When your brand really begins building awareness and momentum, you may begin to see people searching for your brand directly in search engines like Google. The first place this search interest shows up is in your Google Search Console, which allows for reporting over different time periods.
You may even begin to see tools like Ahrefs and SEMrush estimate monthly search volumes for brand-related keywords, though their estimates are merely that.Google’s Keyword Planner andGoogle Trends are other straight-from-the-source places to track branded search volume.
Using Marketing Metrics in Your Business
Do you know the return you’re getting on your marketing spend?
Make the most of every dollar you invest by understanding and measuring the core marketing metrics that drive your business’s success. Armed with this actionable data, you can manage your business in real-time and direct future spend where it will have the biggest impact.
Tools like TrueNorth, a marketing management system that helps marketing teams create adaptable plans and prioritise campaigns, are invaluable for businesses trying to thrive in today’s competitive landscape.
If you’re interested in joining our beta, you can join here. As a Venture Harbour reader you’ll be jumped to the front of the beta queue.
FAQ
What are the 2 main types of marketing metrics?
Marketing metrics fall into two categories: quantitative metrics (numerical data like clicks, conversions, and revenue) and qualitative metrics (customer feedback, sentiment analysis, and brand perception). Understanding the difference between these two metric types allows you to build a comprehensive view of your marketing performance rather than relying solely on numbers.
Why is context important when measuring marketing metrics?
Raw metrics are meaningless without context—a 2% conversion rate tells you nothing if you don’t know your industry benchmark or previous performance. Adding context to your metrics through comparisons, historical data, and industry standards transforms them from vanity numbers into actionable insights that drive real business decisions.
How do you make marketing metrics actionable?
You make metrics actionable by pairing them with SMART goals (Specific, Measurable, Achievable, Relevant, Time-bound) that define what success looks like for each metric. Rather than simply tracking that your email open rate is 18%, a SMART goal would be ‘increase email open rates from 18% to 22% within 90 days through subject line A/B testing.’
What’s the difference between marketing metrics and campaign metrics?
Marketing metrics measure overall performance across your entire marketing strategy (brand awareness, customer lifetime value, marketing ROI), whilst campaign metrics focus on specific initiatives like email campaigns or paid ads (click-through rate, cost per acquisition, conversion rate). Campaign metrics feed into broader marketing metrics to show how individual efforts contribute to organisational goals.
Which marketing metrics matter most for measuring performance?
The most critical performance marketing metrics are those directly tied to revenue: conversion rate, customer acquisition cost (CAC), customer lifetime value (LTV), and return on ad spend (ROAS). These metrics reveal whether your marketing is actually generating profitable business results rather than just generating traffic or engagement.
How many marketing metrics should you actually track?
Rather than tracking all 51 metrics, focus on 5-10 key metrics aligned with your business objectives and regularly review them. Metric overload leads to analysis paralysis and dilutes focus—prioritise metrics that directly impact your revenue, customer acquisition, or retention goals and ignore vanity metrics that don’t drive decisions.
What’s the difference between marketing metrics and marketing measurements?
Marketing measurements are the raw data points you collect (website visits, email clicks, form submissions), whilst marketing metrics are the calculated insights derived from that data (conversion rate, cost per lead, engagement rate). Measurements become metrics when you analyse them in context and compare them against benchmarks or goals.