


There are plenty of marketing statistic articles out there, promising to deliver the most important data points. And, once you start reading them, you find out they’re actually stuffed without dated stats from 2015 that mean nothing in today’s marketing landscape.
So here they are: 19+ up-to-date marketing stats that actually matter. Some of these are from the last few years although some are slightly older where more recent data isn’t yet available or the stat is still relevant.
I’ve broken these stats into the following categories:
- Lead gen & nurturing stats
- Conversion & purchase decision stats
- Search marketing stats & trends
- Paid advertising stats
- Email marketing stats
- Surprising stats that buck some popular “trends”
So this should be the marketing stats article to bookmark if you need a reference of up-to-date info or genuine insights into what the marketing landscape is going to look like this year and the decade ahead.
Lead gen & nurturing stats for 2023
First, let’s start by looking at the lead generation and nurturing stats that matter most for 2020. In this section, there’s a strong emphasis on consumer demands, data and breaking some bad habits that have been developed over the past decade.
01The average consumer journey now involves 20-500+ touchpoints
In 2018, Google released a study looking into the variety of modern consumer journeys. Its findings show that the average consumer journey now involves anywhere between 20 and 500+ touchpoints.
Aside from showing how much variety exists between individual consumer journeys and those within different niches (e.g.: e-commerce vs travel bookings), the variety of channels used and changing user interests across these consumer journeys is staggering.
The findings only reiterate the importance of audience understanding, multichannel marketing and the ability to attribute user actions along the consumer journey in order to deliver relevant messages where they count.
0272% of consumers say they now only engage with personalised messages
Research conducted by SmarterHQ finds that the majority of consumers will only engage with personalised messages. Along with many other studies on the same subject, SmarterHQ’s insights suggest consumers are uninterested in the generic messages they’re bombarded with across the web.
Brands need to show consumers they have their individual, personal needs at heart when delivering messages in 2020.
The same study also reveals that 90% of consumers are willing to share behavioural data for a cheaper and easier brand experience. Which means brands need to make it clear that the data they’re requesting from users is going to deliver cheaper prices and a more convenient experience.
Fail to clarify these two points and you might struggle to secure the data required to deliver the level of personalisation today’s consumers demand in order to engage with your messages.
03At the same time, 86% say they are concerned about data privacy
SmarterHQ also finds that a large majority of users are concerned about data privacy and that 79% of consumers surveyed in this report believe companies know too much about them. Again, this reinforces the point that brands need to sell the idea of data collection, based on the cheaper prices and smoother experiences consumers are looking for.
At the same time, brands also need to ensure they are transparent about what they’re doing with consumer data. For brands targeting EU citizens, GDPR should make this mandatory but these regulations don’t apply outside of Europe, even if the consumer demands are still there.
Don’t just follow GDPR regulations to cover your backside; create lead generation and sign-up experiences that earn user trust. Reassure users that you’re a reputable brand that respects privacy but understands they want personalised experiences.
Ditch the technical jargon and spiel about “your privacy matter to us” followed by swathes of legal text, T&Cs, etc.
Explain to users in plain English why their data is needed in order to deliver personalised experiences and illustrate the benefits they’ve received in exchange for it.
Conversion & purchase decision stats for 2023
As consumer demands change, the defining factors that influence purchase decisions also evolve and brands need to adapt to some important shifts that will define 2023 and the decade ahead.
0856% of users trust SMB websites more than Google My Business
Trust is a key factor in every consumer journey and BrightLocal offered up an interesting finding in early 2019. It turns out 56% of users say they trust the information on a small business website more than the details listed on Google My Business (32%).
This is good news for small businesses concerned about the impact of zero-click searches, which are an inherent part of the Google Maps experience. Once again, however, when business really matters, the majority of users are clicking through to the business’ website to make sure they get accurate info.
Interestingly, the same study also showed that 60% of online users prefer to contact a small business by calling them on the phone.
09Review scores of 3.7 out of 5 deliver the highest conversion boost
Perfection is impossible to attain but, luckily, consumers are smart enough to know this in today’s review-dominated online experience. A study conducted by Uberall found that the perfect review score to maximise conversion rates is anywhere between 3.5 and 3.7 out of 5.
It turns out people are suspicious if a business has 5/5 stars on a review site (fake reviews are no secret) and the number of reviews also plays a factor (the ideal number varies from sector to sector).
Above all, the way in which you deal with complaints, comments and questions on public platforms like Google My Business has a major impact on buyer decisions.
1064% of consumers are now belief-driven buyers who want brands to deliver on societal issues, as well as products
Today’s consumers are increasingly concerned about social issues ranging from ethical manufacturing, climate change and human rights. Brands need to react to this increasing demand and reassess business processes at every level.
1157% of page time is still spent above the fold
While it’s true that users are scrolling further down pages than ever before, thanks to the narrow, vertical nature of the mobile web, findings from Nielson Norman Group reveal that users still spend 57% of their time above the fold - something to keep in mind with homepage, landing page and email design, in particular.
Search marketing stats & trends for 2023
Every year, we’re told again that “SEO is dead” and 2022 was no exception, yet search remains one of the most vital channels for brands across all industries. There’s no doubt the search game is rapidly changing and the constant threat of being left behind can make this one of the most frustrating digital channels to work with. But all the stats point towards search being the key channel for brands in 2020, once again.
04Paid and organic search drive more than 70% of revenue for B2B brands
A study (PDF) carried out by BrightEdge and summarised here on Search Engine Land show that search drives more than 70% of revenue for B2B brands. According to the study, organic search is responsible for 53% of all site traffic and paid search contributes 15% of all visitors to B2B websites.
05Google organic search visits down 8% in Q2 2019 from previous year
Organic search is still the key channel for most brands but it is also true that overall traffic numbers are on the decline. Merkle’s digital marketing report for Q2 2019 revealed that organic search visits were down by 8% from the same time period in 2018.
Contributors include the ongoing increase in paid ads showing on the SERPs and an increase in zero-click searches where users get the information they need from the results page without clicking through to a website (like the example above).
However, what these stats don’t explain is that the majority of zero-click searches come from informational queries that rarely generate valuable business needs. Checking the weather in New York or asking Google who Britain’s first prime minister was aren’t exactly exciting prospects for corporate brands.
Overall organic traffic is down but paid traffic is also on the up and valuable leads are largely unaffected by zero-click searches.
Panic over.
06Google shows featured snippets for 86.3% of desktop searches, 73.3% on mobile
Featured snippets are the most common cause of zero-click searches and these are showing for the majority of queries across desktop and mobile now. Brands need to optimise and compete for featured snippets while formatting content that delivers a suitable answer in the SERPs while enticing them to click through for more information.
Start by identifying the featured snippets that can generate genuine leads, determine your chances of competing and optimise for the spots that are most valuable/achievable.
0791% of content gets zero organic clicks from Google
This stat originally comes from an Ahrefs study and it circulated the web a lot in 2026, normally used to peddle some kind of product, service or predictable marketing strategy.
The reality is, the majority of content gets no organic engagement because the majority of it sucks. If you’re creating content people want to read and delivering it in the right places, you’re safely in the 9% minority.
Paid advertising stats for 2020
With organic search and social media becoming more volatile, paid advertising provides a reliable source of traffic that can be used as a buffer while you adapt your organic strategies.
12Paid search is the fastest-growing ad format in retail
Paid search is now the fastest-growing digital ad format in the retail industry, according to findings from eMarketer. It forecasts that search will account for 47.3% of total retail digital ad spending in 2020 with Amazon taking an increasing share of digital ad spend away from Google in the retail sector.
13Users hate auto-play video ads more than any other format
While search ads continue to rise, the struggle of display advertising are becoming increasingly clear. More accurately, we now have data that explains why users are so frustrated with display advertising and the findings hardly surprising.
Yet more research from eMarketer shows video ads that play automatically on websites (with sound) are the most annoying ad format. While ads that play automatically without sound are still the second-most annoying, according to its figures.
Audio ads on music streaming apps and podcasts are the third most annoying and ads that show up based on previous searches come in at fourth (careful with those remarketing campaigns!).
Only 10% said they don’t find online ads annoying.
Email marketing stats for 2020
Email marketing is another marketing channel that’s been written off in the past yet it continues to prove its worth, especially in today’s extended consumer journey. Email marketing can feel like a thankless task at times but some of the performance metrics are more encouraging than they first appear.
14Email subscribers spend just 1.1 seconds scanning your emails before deciding whether to read them
According to HubSpot, email subscribers who open your emails spend just 1.1 seconds scanning them before deciding whether to read them in more detail. This means you have just over one second to make the message in your email clear and make it compelling enough to encourage further engagement. One way to increase engagement is in the use of video, with research showing that video can multiply open rates by as much as 6 times.
15The average email open rate was 17.92% in 2018
This stat comes from Campaign Monitor’s Ultimate Email Marketing Benchmarks for 2026 report. For any brand looking to gauge its email marketing performance against the industry benchmarks, this is the report to look at and open rates are always one of the most measures of success.
According to the report, the average open rate in 2018 was 17.82% and there are plenty of other insights offered, including:
- Average click-through rate: 2.69%
- Average unsubscribe rate: 0.17%
- Average click-to-open rate: 14.10%
- Average bounce rate: 1.06%
The report also breaks down these metrics into industry-specific benchmarks so you can see how you compare with your competitors and see how much variations can be expected across different industries. Definitely worth taking a look at this report and keeping an eye out for Campaign Monitor’s 2021 update when it comes out later this year.
1661% of people not reading your emails stay subscribed because they expect to do business with you in the future
Smart Insights has its own email marketing benchmark report, filled with its own benchmarks that make for a good comparison with Campaign Monitor’s data. There are plenty of unique insights in the report, too, such as the reasons why subscribers don’t open your emails.
Also writing for Smart Insights, Tim Watson introduces another stat from Zettasphere’s Email Addiction report that explores this topic further. The report found that a sizeable 61% of people not reading emails stay subscribed to lists because they expect to do business with those brands later, even if the present email campaigns aren’t grabbing their attention.
1751% of email marketers say data integration is the biggest obstacle to personalisation
Writing for Econsultancy in October 2019, Nikki Gilliland explained how more than half of marketers say data integration is the biggest obstacle to delivering effective personalisation in email marketing campaigns. This came from Econsultancy’s 13th annual Email Marketing Industry Census, which was published in partnership with Upland Adestra.
“Econsultancy’s survey of more than 400 marketers revealed that personalisation is still a big priority, with 67% of respondents saying the thing they want to improve on is the practise of better personalisation… However, integrating data continues to be the biggest challenge for companies trying to implement personalisation, highlighted by 51% of respondents.”
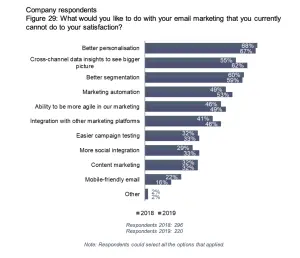
As Nikki explains in her write-up, “this is often due to difficulty in unifying different sources of information, amplified by the plethora of different marketing platforms and tools available,” which highlights the importance of having the right tools to bring all of your data together and visualise it in a single place.
Surprising stats that buck some popular “trends” for 2023
Marketing stats are normally published as a way to support the emergence of new trends and defend the ongoing use of some old ones. The problem with stats is that you can generally find data that supports any argument although a lot of publishers are too lazy to even go that far. Many will simply publish any old statistic like 23% of X will do Y and expect us to be excited by the idea of fewer than 1 in 4 people doing something.
Maybe they think we won’t notice but I suspect they don’t even care.
So, with this in mind, I want to offer up a couple of stats that have genuine weight to them and contradict some of the popular “trends” that are being pedalled to us.
1886% of users still prefer humans to chatbots
Just when you think chatbots are ready to take over and replace human interactions in digital commerce, 86% of respondents to a survey admit they prefer speaking to humans than a bot.
Well, there goes that theory.
This doesn’t mean chatbots don’t have their place in the consumer journey. I’m about as sceptical as anyone when it comes to bots but I can see genuine use cases where they can add value to brand interactions. Not to mention, we’ve previously looked at case studies where bots have had a positive impact.
The problem is, companies invested in this technology try to hype it up as something that’s going to solve world hunger and then people are either disappointed when it doesn’t or realise there’s no single fix to complex problems like customer service in the digital age.
1972% of marketers have no plans to optimise for voice search
While the buzz around chatbots has died down a bit, one of its close relatives is gearing up for years of buzz and hype. Listen to the majority of search marketing experts out there and they’ll tell you voice search is the key trend everyone needs to be optimising for, despite the fact few people are actually using the technology to buy anything.
“Hey Google, what’s the weather like in Trinidad” doesn’t sound like a golden lead generation channel to me.
Surprisingly, 72% of marketers in a recent study said they have no plans to optimise for voice search, almost as if they’ve analysed the business potential of devices like Google Home and decided the opportunities simply aren’t there in enough volume to make it a worthwhile channel - at least, not for now.
Keeping things relevant in 2023
Hopefully, the up-to-date stats in this article will be of some use and/or interest for you in the year ahead. At the very least, this article should act as an example of how a stats article should be compiled when the damn headline promises to deliver information that’s useful and relevant for 2023.
Who knows, maybe this will start a new trend of its own and in 2023 we can all gush over this fresh concept of publishing content that’s actually relevant to its own headline and the keywords people actually type into search engines when they’re looking for something.
FAQ
What are the most important marketing statistics for 2023?
The most important marketing statistics for 2023 focus on lead generation, conversion rates, search marketing trends, and paid advertising performance rather than outdated data from previous years. Current 2023 data is critical because marketing landscapes shift rapidly, and relying on statistics from 2015-2020 will lead you to make decisions based on consumer behaviour that no longer exists.
How many consumer touchpoints should a marketing strategy include?
Modern marketing strategies must account for multiple consumer touchpoints across different channels, as customers interact with brands through various platforms before making purchase decisions. Omnichannel touchpoint mapping has become essential for understanding the complete customer journey and optimising conversion rates across all channels.
What do retargeting statistics show about conversion rates?
Retargeting campaigns consistently demonstrate higher conversion rates than cold traffic campaigns, making them one of the most cost-effective marketing tactics available. Retargeting audiences convert at significantly higher rates because they’ve already shown interest in your product or service, making them warmer prospects than first-time visitors.
Is conversational marketing effective for lead generation?
Conversational marketing through chatbots, live chat, and messaging platforms has emerged as a highly effective lead generation and nurturing tool in 2023. Real-time conversational engagement reduces friction in the buyer journey and allows businesses to qualify leads immediately rather than waiting for form submissions.
Why do many marketing statistics articles use outdated data?
Many marketing statistics articles recycle old data from 2015-2020 because it’s easier to cite existing research than conduct new studies, but this approach misleads marketers about current consumer behaviour. Dated statistics create false confidence in strategies that may no longer work, which is why this article focuses exclusively on 2023 findings that reflect today’s actual market conditions.
What marketing trends from previous years are no longer relevant in 2023?
Several popular marketing ‘trends’ from previous years have been debunked or significantly diminished in effectiveness by 2023 data, which is why this article includes a section specifically addressing surprising stats that buck conventional wisdom. Challenging outdated assumptions helps marketers avoid wasting budget on tactics that worked in the past but no longer deliver results.
How should I use marketing statistics to plan my 2023 strategy?
Use only current 2023 marketing statistics to inform your strategy, focusing on data from your specific industry and audience segment rather than applying generic benchmarks. Contextual, recent data should drive your decisions around lead generation channels, conversion optimisation tactics, and advertising spend allocation rather than assumptions based on historical trends.