

Marketing goals take many forms but they should always set clear targets so everyone on your team knows exactly what they’re working toward - and what counts as success/failure. There are plenty of frameworks for setting specific goals with the SMART format probably being the most widely known.
However, more recently, the objectives and key results (OKR) format has been popularised by some of the biggest names in technology - including intel and Google - as the go-to model for agile teams.
In this article, we’ve drawn up 101 examples of marketing goals and OKRs to inspire your next batch of campaign ideas. We’ll also explain the similarities and differences between the two, as well as their pros and cons, and the examples will help illustrate the different values they have to offer modern marketing teams.
What are we looking at in this article?
The bulk of this article is a list of 101 marketing goal and OKR examples but, before we get into the list, we take some time to clarify what OKRs mean and how they differ from marketing goals. Then, we’ll take a look at how to set marketing goals and OKRs before we start looking at our first batch of examples.
To make this article more digestible, we’ve grouped our example marketing goals and OKRs into categories for some of the most important marketing channels, functions and roles.
Here’s a quick look at everything that’s covered in this article:
- Marketing goals vs OKRs: Definitions of marketing goals and OKRs.
- How to set marketing goals & OKRs: A breakdown of how to set SMART marketing goals and OKRs.
- Inbound marketing goals & OKRs for building a bigger online brand.
- Search marketing goals & OKRs to boost your organic search ranking and PPC results.
- Content marketing goals & OKRs for maximising your audience and influencing purchase decisions.
- Social media goals & OKRs to expand your reach on your most important platforms.
- Email marketing goals & OKRs to maximise lead capture and campaign performance.
- Lead generation / nurturing goals & OKRs to turn more marketing leads into paying customers.
- Conversion optimisation goals & OKRs that’ll maximise the performance of your website and marketing campaigns.
- User experience goals & OKRs to keep prospects engaged and moving towards the next purchase.
- Sales goals & OKRs that’ll close more deals and increase customer value.
- Customer satisfaction goals & OKRs for maximising retention, repeat purchases and lifetime value.
- Revenue goals & OKRs to make your marketing strategy more profitable.
- Marketing effectiveness goals & OKRs that’ll maximise the efficiency of your marketing processes.
You can click on the blue link text above to jump ahead to any given section but, if you’re not 100% clear on what an OKR is and how it differs from a marketing goal, this next section clears everything up.
Marketing goals vs OKRs: What are they & how are they different?
The similarities between marketing goals and OKRs far outweigh the differences - so much so that you can almost think of OKRs as another framework for setting goals. This becomes apparent if we compare the SMART goal framework with the OKR model to see the similarities and differences.
Before we take a closer look at both frameworks, let’s take a quick moment to define them both:
- SMART goals: A framework for setting goals that are Specific, Measureable, Achievable, Relevant and Time-bound.
- OKRs: A framework for setting and managing goals with specific Objectives and Key Results.
At this point, the important distinction is that the SMART framework assists with setting goals while OKRs provide an alternative method for setting goals, but also managing them once campaigns/projects are running. As we take a closer look at the two formats, it will become more apparent why this distinction makes OKRs particularly effective for agile marketing and development teams.
What are SMART goals?
SMART goals are defined using the SMART framework, which applies the five following criteria for defining each goal:
- Specific
- Measurable
- Assignable
- Realistic
- Time-bound
This framework’s origins date back to the work of Peter Ducker and the management by objectives (MBO) philosophy defined in his renowned 1954 book, The Practice of Management. However, the first known use of the SMART acronym was published in the November 1981 issue of Management Review by George T. Doran.
The framework was widely adopted by development and marketing teams around the world during the 1980s and 1990s, including the likes of Intel, Google and large Japanese corporations.
The framework encourages teams and individuals to set specific goals with fixed time frames and define how success will be measured. If we add more context to the five elements of the SMART format, you can see how this helps teams avoid setting vague goals or starting projects without specific objectives:
- Specific: Target a specific area for improvement.
- Measurable: Quantify or suggest an indicator of progress.
- Achievable: Ensure the goal is achievable with the available resource.
- Relevant: Ensure the goal contributes to higher-level business objectives.
- Time-bound: Specify when the result(s) can be achieved.
As we explain in our ultimate guide to marketing strategy, the SMART framework is great for reminding marketers to set specific targets, define the metrics and KPIs to measure success and put time frames on every goal they set - but the model isn’t infallible.
One key thing to keep in mind is that the SMART model is designed for planning goals in isolation. So, the framework, in its default form, is great for individuals setting personal goals or setting primary goals for simple campaigns but it’s less effective for complex projects with multiple goals and, arguably, less effective than OKRs for teams - something we’ll discuss in more detail shortly.
What are OKRs?
OKR is another acronym that stands for Objective and Key Results and this framework is commonly used by agile development and marketing teams for setting and managing goals. The OKR model also has roots in Peter Drucker’s Management by Objectives and later developed into the framework we know today by Intel co-founder, Andrew Grove.
In 1974, a future Google investor and advisor by the name of John Doerr joined Intel and learned OKR during his time at the company. Fast-forward a couple of decades and Doerr would be working at Kleiner Perkins Caufield & Byers - one of the first major investors in Google - and become an advisor to Google during its early days, passing on the knowledge of OKRs to founders Larry Page and Sergey Brin.
To this day, Google sets annual and quarterly OKRs and the framework has become a staple planning tool for Silicon Valley and beyond.
Let’s quickly define the two components of an OKR:
- Objective: A description of what you want to achieve or the direction you wish to take - eg: increase revenue or reduce customer churn.
- Key Result: A measurable outcome that is required to achieve the objective - eg: Q3 revenue target of $350,000+.
Each OKR should only have one objective but it can have multiple key results.
Like SMART goals, OKRs encourage you to set specific goals and define how success is measured. In this sense, the two models have a lot in common, which shouldn’t come as a surprise now that you understand their shared history.
Crucially, though, the OKR framework is designed for setting and managing goals collectively as part of a team or organisation. While the SMART model treats goals in isolation, the OKR format provides a hierarchy that supports organisational structure, as illustrated in this graphic from Perdoo.
As Jeff Gothell writes for Harvard Business Review, OKRs are great for placing emphasis on the progress of goal-driven activities but they can fall short when they’re applied to the individual contributor level - in which case, the SMART goal framework is more suitable.
SMART goals vs OKRs: Which framework to use?
The SMART and OKR both have a lot of things in common but their differences make each model suitable for slightly different applications. As we touched on in the previous section, the SMART framework is designed more for setting individual goals or creating goals in isolation while OKRs are more suitable for teams and organisations.
So, in theory, the OKR format is better suited for setting marketing goals, especially for agile, collaborative and remote teams.
In all honesty, though, you can use and adapt the SMART framework into the same type of hierarchy OKRs promote. How you implement either of these models is more important than which one you choose but OKRs are ready-made for marketing teams and projects with multiple objectives.
Another benefit of the OKR model is that it encourages you to set multiple key results for each objective. Again, though, it’s important to set these key results in meaningful ways and, if you’re using the SMART format, nothing is stopping you from setting multiple targets for the “specific” and “measurable” steps.
Now that we’ve cleared that up, let’s look at how to set marketing goals with both frameworks.
How to set marketing goals & OKRs
Whatever framework you use for setting your marketing goals, you can take lessons from the SMART and OKR frameworks. Both provide a template for setting specific targets with measurable outcomes so that you can define the direction you want to take, specify the metrics for measuring performance and set the threshold for success.
Let’s start with the SMART framework because this is probably the easier to understand and more memorable of the two.
How to set SMART goals
One of the biggest advantages of the SMART framework is it literally spells out the process of setting goals for you. You simply have to satisfy all five elements of the S.M.A.R.T acronym for every goal you define and here’s a quick reminder of what we’re aiming for:
- Specific
- Measurable
- Achievable
- Relevant
- Time-bound
From here, you can define a SMART goal by following these steps:
- Specify your goal: Describe what you want to achieve and the clear direction you intend to take - eg: closing more high-value deals ($100,000+) every year.
- Define success: Determine the metrics and KPIs for measuring success and the target outcome - eg: Increase avg. signups at the value of $100,000+ per year by five.
- Achievability: Check your goal is both ambitious enough but also achievable.
- Relevance: Ensure your goal is relevant to higher-level goals.
- Set a time frame: Set a date for the completion of your goal - eg: +5 $100,000 signups by end of Q3.
Once you’re in the habit of setting SMART goals, it might be tempting to skip steps #3 and #4 because - let’s face it - all goals should be achievable and relevant but it’s worth taking the time to step back and analyse your goals, especially when you’re deep into optimising marketing campaigns or product experiences.
For example, a software company’s primary goal is to maximise revenue and, probably, recurring revenue through a combination of paid accounts and renewals. From here, obvious goals will include customer retention, reducing churn and optimising the product experience, But, once you delve into more specific goals - like increasing the amount of time users spend in your software - it’s easy to lose sight of the primary goals (eg: maximising revenue) if you focus too much on the time users are spending in the product.
You need to make sure that added time contributes to increased revenue so it’s important to always check your goals are relevant to the bigger objectives of the business.
Achievability is also important because you want to know you’re capable of hitting your targets but, crucially, you also want to be ambitious with your marketing efforts. If you prioritise achievability over ambition, you could fall short of your potential for the sake of achieving objectives. This is a tricky balance to strike but the answer lies in your historical performance data, which you can use to predict the outcome of future campaigns.
We use a marketing planning and management tool called TrueNorth to predict the outcome of campaign ideas. The platform’s campaign simulator uses historical performance data and your campaign settings (targets, budget, etc.) to forecast results. Aside from helping us to identify our best campaign ideas, the tool also allows us to push more ambitious goals and see where performance starts to fall short.
This way, we can ensure our goals are both achievable and ambitious so we’re never selling ourselves short.
How to set OKRs
The OKR framework is less descriptive than the SMART format but it’s, arguably, even more straightforward. Before we look at how to set OKRs, let’s quickly remind ourselves of the format:
- Objective: A description of what you want to achieve or the direction you wish to take.
- Key Result: A measurable outcome that is required to achieve the objective.
Once again you start by describing what you want to achieve, in the same way as the “S” in the SMART framework. Then, you start setting the measurable key results, which is also similar to the “M” in the SMART model, except you’re encouraged to include multiple key results for every objective.
Now, in terms of setting an OKR, you simply follow these steps:
- Define your objective: Describe what you want to achieve and the direction you wish to take.
- Set your primary key result: Determine your most important target and pinpoint the metrics and KPIs to measure success.
- Set your secondary key results: Define any other key results that will help you achieve your objective.
For the sake of example, let’s stick with the same objective we set out for our SMART goal in the previous section: close more high-value deals ($100,000+) every year.
From here, you might set your OKR as follows:
- Objective: Close more high-value deals ($100,000+) every year.
- Key result: Win 17+ deals worth $100,000 in 2023.
- Key result: Win 2+ deals worth $100,000 or more in Q1.
- Key result: Win 5+ deals worth $100,000 or more in Q2, Q3 and Q4.
- Key result: Generate $2,760,000 revenue in 2023.
The first key result above defines the most important target for this objective, setting a specific number of high-value deals to win in 2023. Next, you have a key result for Q1 that will start working towards the end-of-year target while allowing relevant marketing strategies to gain traction.
Then, we have more ambitious targets for Q2, Q3 and Q4 to ensure progress keeps working towards that end-of-year target.
Finally, we’ve also set a total revenue target for 2026 as our final key result, which includes revenue generated from the 17 high-value deals and all other deals. This is important because it sets a target that not only achieves our objective but also ensures we wouldn’t hurt total revenue for the sake of targeting higher-value customers.
Once again, keep in mind the OKR framework is designed for setting goals that fit into structured projects with many different objectives, split across a hierarchy of different levels. So it allows for an objective of closing more high-value deals under top-tier objectives for maximising revenue.
As a result, we’ll be using the OKR format for most of our examples in this article, but we’ll also use the SMART framework where appropriate to illustrate its effectiveness for setting individual goals.
Inbound marketing goals & OKRs
First up, we’re looking at the following inbound marketing goals and OKR examples:
- Increase brand awareness
- Increase market share
- Increase website traffic
- Boost brand engagement
- Target a new audience
- Establish industry authority
- Increase brand influence
- Improve brand strength
These will help you build a bigger online brand and give more power to your marketing strategies across every channel.
01Increase brand awareness
In the modern world of multichannel marketing, the goal of increasing brand awareness is the perfect example of why the OKR framework is so important for marketing teams. Not only is this an objective that you can achieve and measure in many different ways but you’re going to need to run campaigns across multiple channels to achieve it.
Right off the bat, you could create three OKRs for this goal, one each for organic search, paid search and social media - and, potentially, more.
Let’s stick with organic search for this example.
- Objective: Increase brand awareness using organic search.
- Key result: Increase search visibility +30% by end of Q1 (using the Visibility metric in Semrush).
- Key result: Boost share of search +5% by end of Q1 (using the Share of Voice metric in Semrush).
- Key result: Increase organic impressions +30% across primary keywords by end of Q4 (using the impressions metric in Search Console).
- Key result: Generate 1,000+ referral clicks from off-site content on third-party websites by end of Q4.
For each key result, you can see we’ve set specific targets, define our metrics and set time frames. In this sense, you can almost follow the SMART framework for each key result to ensure you’re being specific enough with the targets you set.
Semrush is a great tool for gaining insights to power your SEO strategy and its Visibility and Share of Voice metrics will help you measure brand awareness in organic search.
Most SEO platforms offer up the same batch of metrics with some naming variation but Semrush is the only tool I’m aware of that has a dedicated Share of Voice metric at this stage, which saves you working it out from several other metrics.
02Increase market share
Like brand awareness, market share is a multifaceted metric and this isn’t something you can optimise through one channel. If we take the Investopedia definition, market share is: “the percent of total sales in an industry generated by a particular company”.
In other words, this represents your share of all potential sales in your industry and a measure of your position in the market against your competitors.
This is a priority for every business and a top-level OKR at the organisational level but, if we focus on the marketing perspective, an OKR could look something like this:
- Objective: Lift market share from 12% to 15% in 2023.
- Key result: Increase customer acquisitions by 33%.
- Key result: Increase customer retention by 15%.
- Key result: Boost keyword visibility, share of search, impression share, etc. vs competitors.
Now, this is merely an example OKR so the figures above mean nothing but you shouldn’t pick numbers out of the air when you’re setting marketing goals. If increasing customer retention by 15% is one of your key results, you need to know this result contributes to achieving the objective of lifting market share from 12% to 15% in 2023.
You need to know that hitting all of your key results will achieve your objective and this requires data calculations, not guesswork. This is why it’s so important to run the numbers before you approve any campaign/strategy and another reason TrueNorth’s campaign simulator is such a powerful feature.
With the simulator, we can define goals like increasing market share and run the numbers on our key results to make sure we’re setting the right targets. By running these calculations, we can also check that our objective is achievable and - if we’re setting our sights too short - the projection will reveal where we can afford to be more ambitious.
03Increase website traffic
For most marketing teams, increasing web traffic should be a secondary goal or objective to reinforce another - eg: increasing conversion rates and, then, generating more traffic. The obvious exception is publishers or other online ventures that generate revenue directly from page visits, of course.
That being said, if your website or specific pages are generating strong ROI or close to maxing out performance (eg: sales), it makes sense to drive more traffic and increase the returns further.
Either way, if increasing traffic is your primary goal for any campaign, it should mean everything else is in a strong position to maximise the value of increased visitor numbers. In this case, increasing traffic is a goal in isolation, which makes the SMART framework more suitable.
- Specific: Increase traffic +35%.
- Measurable: Track the Users metric in Google Analytics.
- Achievable: Confirm the traffic increase is achievable with campaign ideas - eg: more posts per month, social posting, paid ads, etc. - you can do this with TrueNorth.
- Relevant: Confirm the traffic increase contributes to higher-tier goals (eg: increasing revenue, conversions, etc.) - again, you can do this using TrueNorth.
- Time-bound: Complete goal by end of Q4 2023.
Although the SMART model is effective in this case, the OKR model still provides additional room for setting multiple results for different channels (organic search, paid search, social, etc.) and a structure suitable for multiple teams.
04Boost brand engagement
Optimizely defines brand engagement as follows:
“Brand engagement refers to the creation of attachments between consumers and brands. These attachments may be emotional or rational, and they produce brand loyalty over time. This solidifies the brand and helps to improve the customer experience.”
Brand engagement; Optimizely Optimization glossary
How this engagement takes place depends on the customer experience you’ve designed but an example OKR might look like this:
- Objective: Boost engagement across website and mobile app.
- Key result: Increase the time users spend on important pages by 30% (using the Avg. Time on Page metric in Google Analytics).
- Key result: Increase the average amount of time users spend in your mobile app per session (using the session duration metric in Google Analytics).
- Key result: Increase the average number of weekly sessions per user.
- Key result: Increase valuable actions per session by 5% (using events measurement in Google Analytics).
- Key result: Reduce customer churn by 15%.
The key with brand engagement goals is identifying the interactions that contribute to revenue and other top-level goals. For example, you might analyse user data to identify habits that typically lead to customer retention, such as benchmarks for session durations, sessions per week and specific actions that represent high engagement.
05Target a new audience
If you’re looking to target a new audience, you might look at search and social (both organic and paid) to start reaching a different group of people.
Your OKR could look something like:
- Objective: Target remote workers looking for software to improve productivity while working from home.
- Key result: Rank on page one of Google for “working from home software” by end of Q1 2023.
- Key result: Generate 15,000+ monthly organic visits from “working from home software” keyword by end of Q2 2023.
- Key result: Reach 5,000+ users per month with topical content on social media by end of Q2 2023.
With organic search, you’re relying on keyword targeting to reach your new audience but paid channels allow you to reach specific audiences with targeting settings.
06Establish brand as an industry authority
Brand authority describes the perceived trust your target audience has in your business and the extent to which they see you as a subject expert in your field. If you’re looking to establish your brand as an industry authority, you might define an OKR along the lines of this:
- Objective: Establish brand as an industry authority with an integrated content marketing and SEO strategy.
- Key result: Rank in top positions for competitive topical keywords.
- key result: Establish a high share of search for emerging topical keywords.
- Key result: Secure one high-profile guest blogging opportunity per month on industry-leading websites.
- Key result: Earn links from industry-leading websites via thought-leadership content.
- Key result: Increase brand searches +30% by end of Q4 2023.
- Key result: Increase brand impressions +35% by end of Q3 2023.
In general, authoritative brands rank well for topical keywords and respond quickly to emerging topical keyword opportunities, establishing a strong share of search before less authoritative brands catch on.
You would also expect to earn links from other authoritative websites - not only brands within your own industry but also those relevant or interested in your topics.
07Increase band influence
While brand authority refers to qualities like trust and expertise, brand influence describes your ability to change people’s minds. This influence can be within your industry - for example, when you publish an article or release a new feature, your competitors take note and respond.
A good example of this would be how Snapchat influenced the product development of Instagram under Facebook’s ownership.
The other kind of influence you should be interested in is over your target audience. This means that, when you talk, they listen. When you promote an upcoming product, they get excited about it. And, when you launch a new marketing campaign, they respond in good numbers.
Let’s stick with the latter as we put together an example OKR.
- Objective: Increase brand influence among target audiences.
- Key result: Capture 30% more leads during the pre-launch promotion of your next product.
- Key result: Hit an 18% conversion rate on the launch day of your next product.
- Key result: Increase brand mentions within 24hrs of major announcements (releases, promotions, teasers, etc.) by 30%.
- Key result: Reduce response times (likes, shares, comments, etc.) to social media posts to <5s.
As your brand influence increases, you should see your target audience respond to your moves with meaningful actions, faster and in greater numbers. You should get more immediate engagement on social media, higher conversion rates on launch days and spikes in brand mentions when you announce something exciting.
08Increase brand strength
Brand strength represents a company’s perceived value and resilience compared to its market competitors. Strong brands can sustain their position in the market while others may struggle during times of disruption or intensified competition.
A strong brand like Coca-Cola isn’t worried when a new soft drink hits the market but companies with weaker brands are more susceptible to market disruption.
Brand strength is double faceted in the sense that you have the true strength of the brand (revenue, budget, cash reserves, market share, etc.) and perceived strength (awareness, authority, influence, exposure, prevalence, etc.).
Both are valuable in different ways and a company like Coca-Cola is doing well on both fronts.
If we focus on building the true strength of a brand, our OKR might look like this:
- Objective: Increase brand strength within your industry.
- Key result: Lift market share from 12% to 15% in 2023 (one of our previous objectives).
- Key result: Maintain an 18+% growth rate between 2021-2024.
- Key result: Increase share of search for top keywords +30% by end of Q3.
- Key result: Increase share of voice (brand mentions vs competitors) +12% by end of Q4.
Sprout Social is a great tool for measuring your share of voice across social media. The platform includes a suite of social listening tools for you to measure brand mentions, impressions and engagement vs your competitors.
Share of voice tells you how often people are talking about your brand in relation to your competitors - a strong signal for both true and perceived brand strength. By combining this with engagement metrics, impression data and other comparisons, you can determine how brand strength translates into social actions.
Search marketing goals & OKRs
In this section, we’re looking at the following search marketing goals and OKRs:
- Maximise search visibility
- Rank in top 3 positions for primary keywords
- Outrank competitors
- Increase impression share
- Increase share of search
- Increase CTRs
- Maximise return on ad spend (ROAS)
- Earn high-quality backlinks
- Secure content placements on high-DR websites
These will boost your presence in organic search and capture more leads at the top of the funnel while capturing more prospects further along the buying process with PPC campaigns.
09Maximise search visibility
Backlinko describes search visibility as “the share of traffic that a website receives from its rankings in the organic search results”. So, let’s say you rank in position #3 for a specific keyword and third place receives 20% of all clicks for that keyword - this would mean your search visibility for this specific keyword is 20%.
In fact, Backlinko has also done research into keyword search visibility and found that the third organic result in Google receives an average of 18.6% of all clicks.
Search visibility is a common metric in SEO tools and you can normally track visibility for individual keywords, your whole website, specific pages and lists of keywords. Which means you can optimise search visibility to increase the share of clicks your site receives at the domain, page and keyword levels.
With this in mind, we could set a SMART goal that looks something like this:
- Specific: Increase search visibility to ≥22% for primary keyword list.
- Measurable: Track the search visibility metric in Semrush for custom keyword list.
- Achievable: Simulate campaigns and experiments to check search visibility target is achievable - you can do this with TrueNorth.
- Relevant: Confirm the search visibility increase contributes to higher-tier goals (eg: increasing revenue, conversions, etc.) - again, you can do this using TrueNorth.
- Time-bound: Complete goal by end of Q4 2023.
In this case, we’re putting together a list of primary keywords (ie: our most important keywords) and tracking search visibility for them in Semrush. We set a minimum target of 22% search visibility for every keyword and start putting together campaign and experiment ideas, including content campaigns, link building strategies and technical SEO optimisations (Core Web Vitals, loading times, page titles, descriptions, etc.).
10Rank in top 3 positions for primary keywords
Ranking in the top organic positions is the best way to maximise search visibility and the traffic received from specific keywords. In the previous example, we linked to a Backlinko study that shows position #3 in Google Search receives 18.66% of all clicks while the top three positions take more than 75% of all traffic:
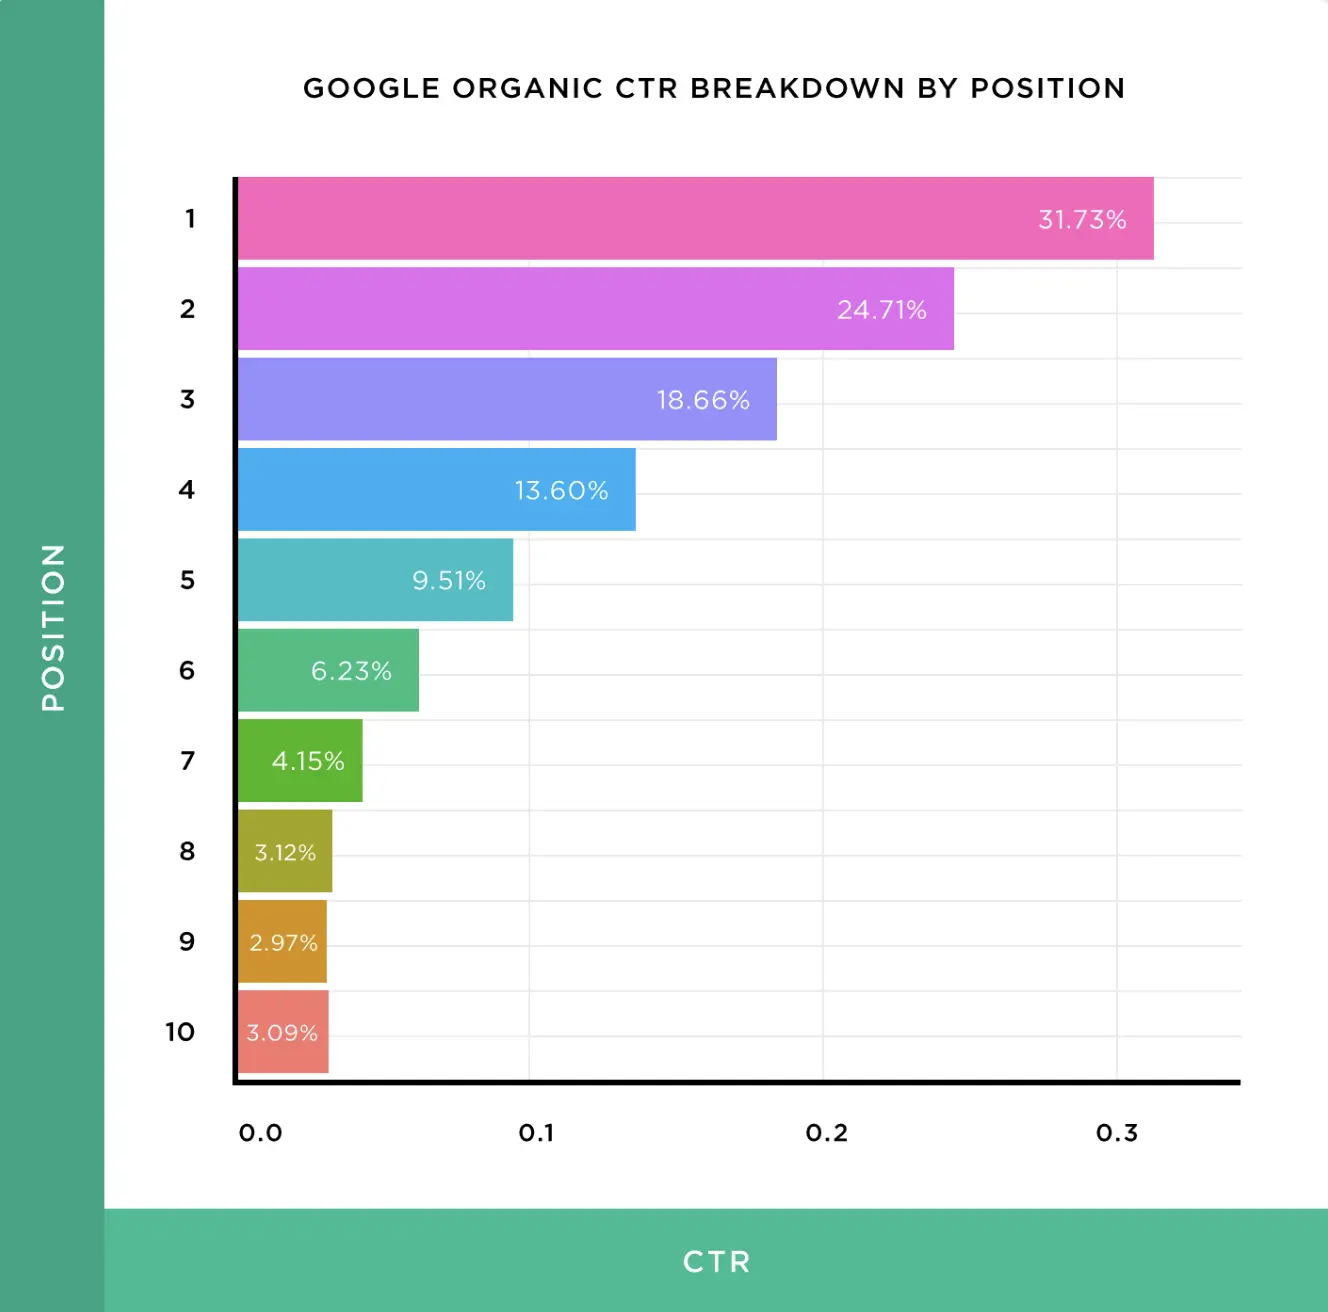
Source: Backlinko
In the previous example, we set a goal of achieving ≥22% search visibility for our primary keywords and, based on the same Backlinko data, this would require us to rank in the top three positions for most keywords.
- Objective: Rank in positions 1-3 for primary keywords.
- Key result: Reach ≥22% search visibility for each keyword.
- Key result: Increase traffic from all primary keywords by ≥5% (based on projections in TrueNorth).
- Key result: Increase revenue from organic traffic by ≥1.5% (based on current conversion rates and projected traffic volumes).
As you can see, we’re not simply targeting higher rankings for the sake of it but calculating the impact this will have on business performance. based on current performance, we project a revenue increase of at least 1.5% from organic search if we hit our targets and we could potentially increase this further with conversion optimisation campaigns once we hit our initial target.
11Outrank competitors
With many of the goals and objectives we’re discussing in this article, both the OKR and SMART frameworks provide suitable templates. However, when it comes to broad objectives like outranking competitors, this doesn’t really fit into the SMART framework.
This is because outranking competitors is completely arbitrary until you specify what you’re going to gain from ranking above them in the SERPs. With the SMART framework, it’s easy to dismiss this as being too vague but outranking competitors is a legitimate marketing objective and the OKR framework helps you validate it with key results.
For example:
- Objective: Climb one position in the SERPs for primary keywords.
- Key result: Increase search visibility ≥3.5% for primary keywords.
- Key result: Increase traffic by ≥5% from primary keywords.
- Key result: Increase revenue from organic search by ≥1.5%.
By defining specific outcomes, you can set broad marketing objectives that yield meaningful results and demonstrate their value. You can take ambiguity and “fluff” out of objectives like ranking above competitors or optimising the experience of software products by placing emphasis on the outcomes.
Better yet, you forecast results in a system like TrueNorth to show stakeholders the impact something like ranking above competitors can have upon business performance.
12Increase impression share
Impression share is a PPC metric that Google defines as “the percentage of impressions that your ads receive compared to the total number of impressions that your ads could get.”
Google calculates impression share by dividing the impressions your ads receive by the “total eligible impressions” that your ads could receive. Eligible impressions are estimated using a range of factors, including targeting settings, ad quality, bids and budget.
A high impression share says your ad is getting plenty of visibility while low impression shares suggest your ads aren’t getting seen as often as they could. In other words, you’re not taking full advantage of the visibility within reach and your ad could be seen by more people if you increase your bid or budget.
Increasing impression share gives your message further reach and you can also optimise it to maximise the returns on top-performing campaigns.
Let’s look at a potential OKR for increasing impression share:
- Objective: Target impression shares of ≥75% for all ads with ≥5% conversion rate.
- Key result: Incrementally increase bids on relevant campaigns by a maximum of 10% over Q2.
- Key result: Ensure conversions remain at ≥5% as impression share increases.
- Key result: Maintain return on ad spend (ROAS) of ≥300%.
- Key result: Maintain average conversion value across campaigns.
- Key result: Increase revenue from campaigns by ≥2.5%.
With this OKR, the aim is to ensure your best campaigns are maximising their potential by reaching the widest possible audience. In theory, these campaigns should continue to perform at a high level as they reach more people and, even at the same conversion rate, generate more total conversions and revenue.
To make sure this works out in practice, you want to ensure conversion rates, conversion value and ROAS remain consistent as you increase bids. For campaigns that don’t respond as expected, you can optimise for the other factors that affect impression share (ad quality, CTRs, etc.) and hold back on increasing bids.
13Increase share of search
Share of search shows the number of searches one brand receives divided by the total number of searches for all brands within the same category. In other words, this is the share of search you receive among all searches relevant to you and your competitors. Research has found share of search represents 83% of market share and detected a strong correlation between changes in share of search and market share.
When search is responsible for almost 70% of all online traffic, share of search has become an integral measurement of market share for modern brands.
- Objective: Increase share of search +3% by end of Q4.
- Key result: Rank in positions 1-3 for primary keywords.
- Key result: Increase search visibility ≥3.5% for primary keywords.
- Key result: Increase traffic by ≥5% from primary keywords.
- Key result: Increase revenue from organic search by ≥1.5%.
The issue with share of search is that it doesn’t consider the gap between search and sales. Clearly, the correlation between searches, sales and market share is strong but the gaps between share of search and financial performance are larger for some companies than others.
One example would be a company going through a PR crisis where searches may be spiking but sales and stock prices are heading in the opposite direction.
So attribution is crucial here, because you want to link search volumes to sales and other financial KPIs, and you also need a system capable of detecting search increases that don’t correlate with increased market share.
14Increase CTRs
Click-through rate (CTR) measures the percentage of users who click on your listing, ad or post divided by the total number of impressions. So, this tells you the number of clicks you’re getting from all of the potential clicks available to you, which means CTR is a great measure of how compelling your search listings, ads and posts are.
If we focus on organic search for the moment, high CTRs suggest you’ve matched the intent of the user and crafted a compelling title and description to encourage them to click through. Of course, we also have to consider other important factors, especially that top-ranking listings receive more clicks than lower-ranking results.
Whatever factors determine your CTR, higher click-through rates mean more traffic, more data and more business opportunities.
- Objective: Increase organic CTRs by 3.5% for primary keywords.
- Key result: Increase traffic by ≥5% from relevant keywords.
- Key result: Increase revenue from organic search by ≥1.5%.
Increasing CTRs for primary keywords can be challenging because they’re normally the most competitive keywords you’re targeting. However, small percentile gains can reflect big financial results when you’re dealing with high-volume, high-converting traffic.
15Maximise return on ad spend (ROAS)
Return on ad spend (ROAS) is one of the most important measures of advertising profitability, dividing the revenue generated by a campaign by the total ad spend.

Source: Instapage
Keep in mind, ROAS doesn’t include other expenses outside of ad spend (advertising services, wages, landing page development, etc.) so it’s also worth calculating ROAS alongside an ROI metric that includes all associated expenses.
ROAS is a simple, effective indicator of PC performance because it directly compares the revenue generated by a campaign vs ad spend. It’s also one of the most useful metrics for optimisation as it helps you maintain or improve the balance between revenue and cost as you test new settings.
if you’re looking to maximise the ROAS of your PPC strategy, one possible OKR could be:
- Objective: Increase average ROAS to ≥300% across campaigns.
- Key result: Increase average conversion rates by ≥1%.
- Key result: Increase average conversion value ≥2.5%.
- Key result: Reduce bids on campaigns that don’t respond to CRO by 5%.
- Key result: Increase bids on campaigns that respond to CRO by 5%.
- Key result: Continue redistributing ad spend by 1% until ROAS stops increasing.
- Key result: Increase total revenue by ≥15%.
As with any campaign designed to increase profitability, you have to ensure that improved ROAS is reflected in revenue earnings. A lot of advertisers fall into the trap of increasing ROAS and ROI by cutting costs, which could potentially help you earn the same amount for less. The problem with this approach is that you’ll never maximise performance because you’re limiting results through limited spend.
Instead, you want to maximise the returns on the maximum budget you can assign to advertising campaigns. So, instead of cutting costs, you want to prioritise increased conversions, increasing conversion value and generating more profit from your current budget.
Then, you can start thinking about whether you want to invest more or less of your total marketing spend on paid advertising - once you’ve maximised performance.
16Earn high-quality backlinks
Quality backlinks are still one of the most important ranking factors in search engine algorithms. if you’re looking to improve your search ranking, expand your audience outside of the search experience and build brand awareness, earning high-quality backlinks is a priority in your SEO strategy.
Here’s what an OKR for this could include:
- Objective: Earn 3x backlinks from DR75+ websites per month (to your own content, not guest blogs).
- Key result: Earn 5-10 backlinks from DR50-DR75 websites per month.
- Key result: Increase monthly referral traffic by 10%.
- Key result: Achieve ≥1.5% conversation rate on referral traffic (downloadable content).
Domain Rating (DR) is a metric in Ahrefs that measures the domain quality of websites, allowing you to specify backlink targets of specific scores. You’ll find similar metrics in other SEO tools, such as Domain Authority (DA) in Moz and the Authority Score in Semrush.
For this specific marketing goal, we’re focusing on generating backlinks to important pieces of content on your website, not links earned through guest blogging or other off-site content placements - something we’re focusing on in the next point.
17Secure content placements on high-DR websites
Offsite content placements can include guest blogs you submit on target websites, reviews written about your products, comparisons, news coverage or editorial content that discusses your brand or its products/services. Rather than linking back to your own content (eg: blog posts), these content placements should link back to your most important pages: homepage, product pages, landing pages, etc.
Once again, you’re looking for high-DR websites to boost the organic ranking of these pages and also direct targeted traffic - eg: potential buyers from reviews or comparisons.
If we follow the SMART framework for this goal, we might come up with something like this:
- Specific: Secure 3x content placements on DR75+ websites per month.
- Measurable: Measured using the Domain Rating (DR) score in Ahrefs.
- Achievable: Calculated on current list of target websites, backlink frequency and link DR scores.
- Relevant: Simulated traffic and revenue increases from achieving goal (simulated in TrueNorth).
- Time-bound: Achieve goal by end of Q4.
You could also create a secondary SMART goal for this campaign targeting a higher volume of placements with slightly lower DR scores - let’s say DR50 to DR75 - and prioritise relevance over Domain Rank with the aim of generating more traffic from potential buyers.
Content marketing goals & OKRs
In this section, we’re looking at the following content marketing goals and OKRs:
- Maximise page views
- Increase Avg. Time on Page
- Increase on-page engagement
- Get content shared on social media
- Attract inbound links
- Generate leads from content
- Improve old content
- Maximise CTA impressions & clicks
The aim is to produce more effective content for your target audiences, publish it across the platforms they’re most active on (search, social, third-party sites, etc.) and position yourself as an influence on their buying decisions.
18Maximise page views
Our aim here is to increase the average number of page views for both new and existing pages on your website and set a minimum target for your most important pages. For example, let’s say your current average is 150 daily page views and your most important pages (homepage, product page, landing pages, etc.) average 225 organic page views per day.
You might set an OKR for increasing average page views along the lines of this:
- Objective: Increase average page views to 300+ per day.
- Key result: Increase avg. page views for key pages to 450+ per day.
- Key result: Increase avg. page views per session to 5+.
- Key result: Update or remove old content with under 250 page views per day.
- Key result: Combine and update pages competing for the same keywords.
- Key result: Increase CTRs from organic search by 15%.
- Key result: Reduce bounce rates by 25%.
- Key result: Increase social referral traffic by 30%.
- Key result: Lift conversion rates to ≥4.5% from organic sessions.
With this approach, you’re setting key targets to hit for average pages and your most important pages while optimising content for organic CTRs but also paying attention to what users are doing on your website by reducing bounce rates and increasing the average number of page views per session.
Most importantly, we’ve set a key result for lifting organic conversion rates to a minimum average of 4.5% to ensure these optimisations are generating profitable results. It’s easy to treat page views as a vanity metric but the OKR above shows an understanding that page views alone doesn’t translate to business opportunities.
19Increase Avg. Time on Page
Page views can be a shallow metric by itself but you can start to build a stronger picture of how users are interacting with your website when you compare it with other insights - and Avg. Time on Page is one of the first metrics you should look at.
If we take a look at the following visualisation published on Klipfolio’s Metric HQ (data from Contentsquare), the average amount of time spent on a page across all industries is 54 seconds with B2B sites achieving the highest average of 82 seconds.
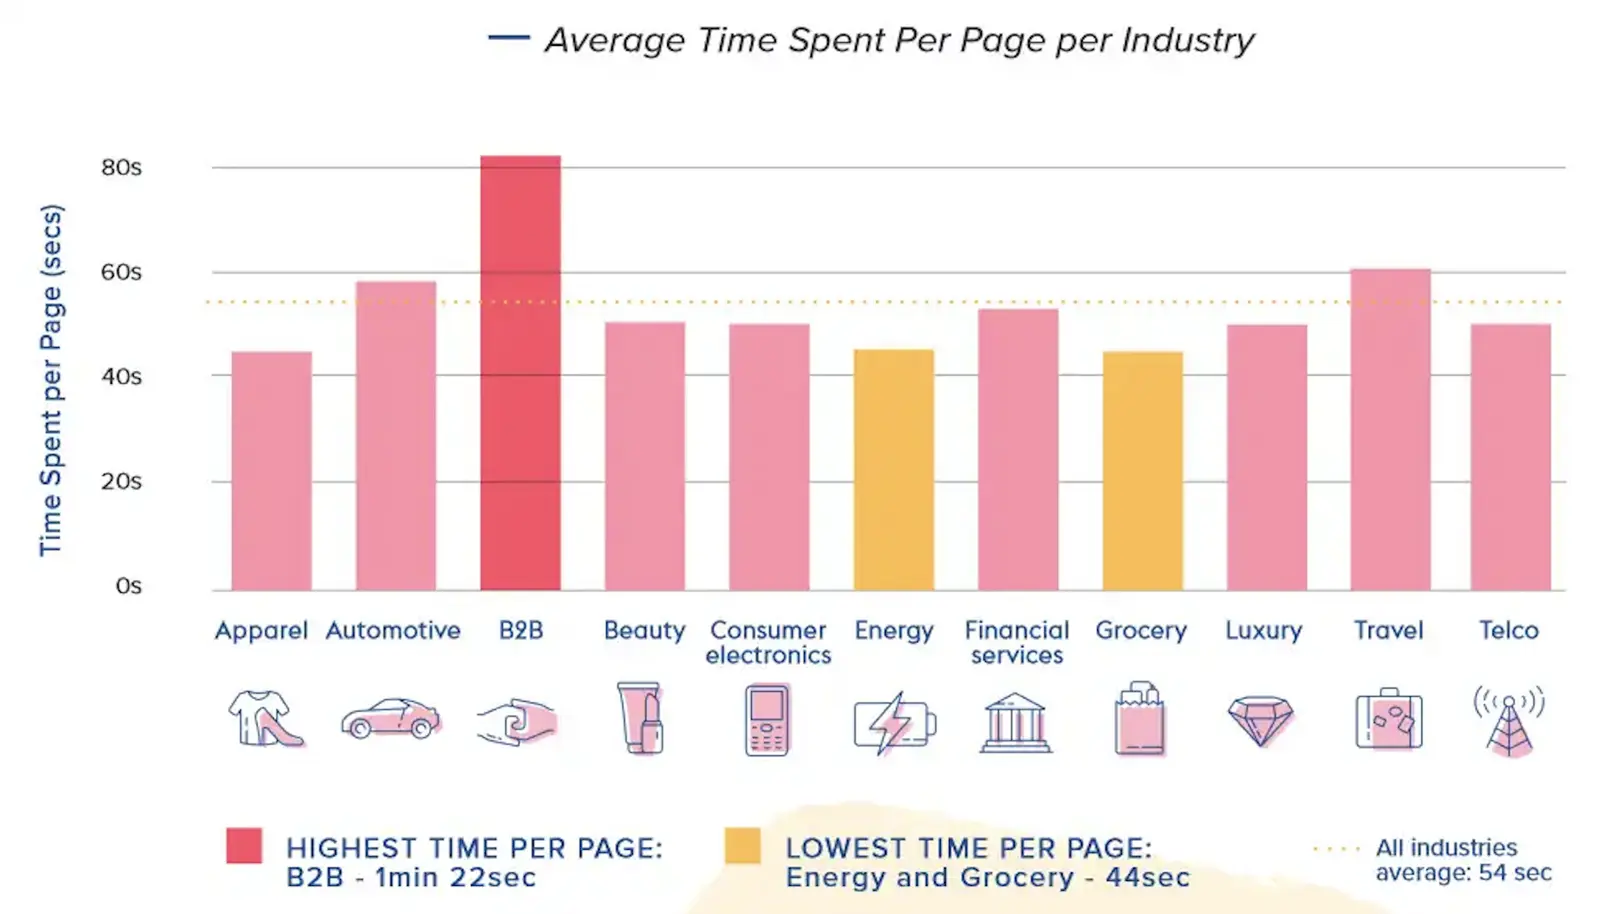
So let’s use this data as the basis for our OKR to increase Avg. Time on Page:
- Objective: Increase Avg. Time on Page to 60+ seconds.
- Key result: Increase Avg. Time on Page for landing pages to 120+ seconds.
- Key result: Increase Avg. Time on Page for blog posts to 5+ minutes.
- Key result: Maintain organic conversion rate of ≥4.5%.
- Key result: Maintain avg. page views per session of 5+.
- Key result: Increase average length of blog posts to 5,000+ words.
- Key result: Reduce bounce rate on blog pages to ≤60%.
Once again, we’re distinguishing between all pages and the key pages on your website (homepage, product pages, landing pages, etc.) with a more ambitious target for the most important pages. We’re also setting a much higher target for blog posts and other pages that are designed to achieve higher engagement.
It’s also important that we keep an eye on conversion rates to ensure more time spent on our pages converts into similar or improved conversion rates (%) and increased total conversions.
20Increase on-page engagement
Avg. Time on Page is a useful metric for assessing on-page engagement but, much like page views, it’s easy to use Avg. Time on Page as a vanity metric. To ensure our optimisations are genuinely improving on-page engagement, we have to track a wider set of metrics.
For example, we might define an OKR like this:
- Objective: Increase on-page engagement.
- Key result: Increase Avg. Time on Page to 60+ seconds.
- Key result: Increase Avg. Time on Page for landing pages to 120+ seconds.
- Key result: Increase avg. page views per session to 5+.
- Key result: Maintain organic conversion rate of ≥4.5%.
- Key result: Increase scroll depth to ≥60%.
- Key result: Increase returning visitors +25%.
- Key result: Reduce bounce rates to ≤50%.
Like many of the marketing goals and OKRs we’ve looked at in this article already, we’re talking about a very broad objective here - one that’s vague and subjective until you define your metrics and set specific targets.
21Get content shared on social media
Social media is an excellent place to promote your content, build your audience and get your message seen by more people. To gain this traction, you need a following that not only engages with your content but also shares it with their own followers - at least, on the networks where organic reach is still viable.
Facebook reach is basically a thing of the past and it’s constantly getting more difficult to reach people on Instagram without paying for ads but some networks still provide a platform that delivers organic reach, such as Twitter and newcomers like TikTok.
If we’re setting an OKR, we need to ensure followers are genuinely engaging with our content, sharing it and that shares are resulting in referral traffic:
- Objective: Increase social media shares by ≥30%.
- Key result: Grow social media audience by ≥50%.
- Key result: Reduce social content production time by ≥35%.
- Key result: Increase social referral traffic by ≥15%.
- Key result: Maximise shares by promoting top-performing posts.
- Key result: Refine list of social networks and content formats that perform.
Social shares are one of the most elusive targets in social media marketing and it’s only getting more difficult to turn organic reach into wider audiences. You’ll have to experiment with networks and content formats to find the right mix and try not to over-rely on one network because you’ll be vulnerable to algorithm changes, such as Instagram’s recent push towards video reels.
22Attract inbound links
Earlier, we talked about inbound links as an SEO strategy but content is the key substance of any link building strategy. Producing content that attracts inbound links is an ongoing goal for any content marketing team so we definitely need an OKR for this:
- Objective: Earn ≥3x inbound links from DR75+ websites per month.
- Key result: Increase referral traffic from external websites by ≥15% (excluding search engines, social networks, etc.).
- Key result: Increase Avg. Time on Page for blog posts to 5+ minutes.
- Key result: Increase avg. page views per session to 5+.
- Key result: Reduce bounce rates to ≤50%.
- Key result: Produce one data study per quarter for link building.
- Key result: Earn ≥2x inbound links from data studies (DR75+ websites) per month.
- Key result: Update previous data studies every six months to continue earning new links and keep existing ones.
- Key result: Convert ≥3.5% of referral traffic into email marketing leads.
As you can see, we’ve got a fairly comprehensive OKR above, one that’s based around a clear strategy of producing regular data studies to attract links every month. To maximise reach, links and shares, we can optimise the studies to make them more “linkable” - eg: including plenty of visualisations with embed codes and allowing publishers to download data files so they can create custom visualisations in their own software, provided they link to us as the original source.
23Generate leads from content
Generating leads from content is another broad marketing goal that’s too vague without a carefully crafted plan. Let’s assume you’re already producing content that delivers enough value to bring relevant traffic to your website - now, you need to convert these page visits into business leads.
Let’s take a look at our example OKR:
- Objective: Generate ≥250 leads per month from organic content.
- Key result: Convert ≥3.5% of organic leads into paying customers.
- Key result: Win 8.25 customers per month from organic leads (105 per year).
- Key result: Minimum avg. conversion value of $1,163 per customer from organic leads.
- Key result: Earn ≥$115,000 annual revenue from organic content.
As we’re talking about generating business leads with this OKR, it’s important to set out the financial key results you need to achieve. First, you need to determine your revenue target and define a realistic set of targets for capturing leads, how many of these leads you need to convert into paying customers and the conversion value you have to achieve in order to hit your revenue target.
24Improve old content
Here we’ve got another broad marketing goal and this is particularly subjective because “improve” doesn’t specify anything. So this is far too vague for the SMART framework, which requires a single specific goal but you can use the OKR model, as long as you set specific targets for each way you want to improve older content.
- Objective: Improve old content to maintain search ranking and continue earning links.
- Key result: Increase organic CTRs by 3.5%.
- Key result: Increase page views by 5%.
- Key result: Increase referral traffic by 5.5%.
- Key result: Maintain search visibility for primary keywords.
- Key result: Maintain top 1-3 positions for primary keywords.
- Key result: Maintain organic conversion rate of ≥3.5%.
In this case, we’re specifying that improved content should continue to gain incremental traction in terms of page views, referral traffic and CTRs while maintaining search visibility and rankings for primary keywords. Additionally, we need to ensure content updates and improvements keep conversion rates on target to generate the required ROI from content production and maintenance.
25Maximise CTA impressions & clicks
To get a return on investment from your content marketing strategy, you need visitors to convert into leads and paying customers. The first step of this is a CTA impression where users can physically see your call to action on the screen. Next, you need users to click on your CTA button and complete the conversion process.
So our OKR for maximising CTA impressions and clicks could look like this:
- Objective: Maximise CTA impressions and clicks.
- Key result: Increase primary CTA impressions to ≥75%.
- Key result: Increase CTA clicks to ≥12%.
- Key result: Reduce loading times to <2s.
- Key result: Include primary CTA in top 50% of every page (including blog posts).
- Key result: Include CTA at the end of content on every page.
- Key result: Increase conversion rate to ≥7.5%.
First, we want to make sure every page has at least two CTAs, at least on the first half of the page and a final CTA at the end of your content. Keep in mind, any pages with CTA in the primary viewport will have artificial 100% CTA impressions so you might want to ignore this metric for such pages or track the second CTA instead (this second approach isn’t exactly perfect, either).
Whichever way you measure CTA impressions, you want a healthy majority of visitors to scroll far enough down the page to see your primary/secondary call to action. First of all, this suggests users are engaging with your content (at least enough to scroll and reach your CTA) and it also provides the first chance to secure the conversion.
Next, you should expect to see a CTA button click rate significantly higher than your target conversion rate. Unfortunately, conversions rarely end with a CTA button click and you’re always going to lose a certain percentage of conversion between the initial button click and the complete action, but you can optimise to narrow this gap later.
In the meantime, you’ve got targets for CTA impressions, CTA button clicks and conversion rate targets that help you optimise your content for the results that matter.
Social media goals & OKRs
In this section, we’re looking at the following social media goals and OKRs:
- Increase social media followers
- Build a larger social audience
- Improve social engagement
- Increase brand mentions
- Improve the reach of organic posts
- Increase social click-through rates
- Increase social share of voice
- Create viral campaigns
- Increase sales via influencer marketing
These goals are designed to maximise your reach across the platforms most important to your target audiences and build engagement that you can nurture into business opportunities
26Increase social media followers
The first goal of any social media strategy is to build followers who will interact with your content and spread your message further through their own list of contacts. like many of the metrics we’ve discussed in this article, social media followers easily becomes a vanity metric - arguably, the vainest of them all.
So we’re not simply looking to build the biggest list of social media followers we can. Instead, we want to build a following of people with a real interest in your brand and the content you create because these are the people who will interact with your social posts and expand their visibility to a wider audience.
- Objective: Increase social media followers by 30%.
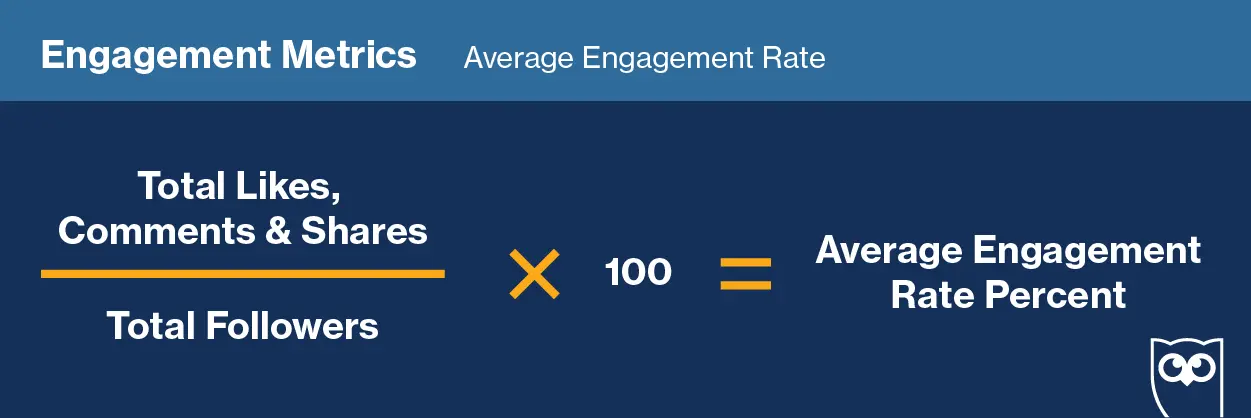
- Key result: Average engagement rate of 5.4% (tracked in Hootsuite).
- Key result: Average post reach of 9.3%.
- Key result: Increase social referral traffic by 12%.
- Key result: Increase social conversion rate to ≥3.5%.
To track social media performance across multiple networks, you’re going to need a dedicated analytics system like Hootsuite to pull all of your social data together. You can also use Hootsuite to track specialist metrics such as engagement rate, which is important to monitor as your following grows.
As your audience grows, you need to know followers are still interacting with your messages, helping to drive them further and that people are still clicking through to your websites and taking action.
27Build a larger social audience
If we borrow the definition from Facebook’s estimated audience size metric, we could define a social audience as: “how many people meet the targeting and ad placement criteria that advertisers select while creating an ad.”
Twitter offers up a similar definition for its audience estimate metric but these metrics only apply to aid campaigns. In the case of Facebook, organic reach is basically a thing of the past for brands but you can still reach people on some networks so we also have to consider organic reach, which includes the portion of your followers who regularly see your posts and anyone else who sees them through connections, topical interests, searches, recommendations or other interactions.
With this in mind, let’s take a look at our example OKR for building a bigger social audience:
- Objective: Increase our social audience by 30%.
- Key result: Increase organic reach by 3%.
- Key result: Increase engagement rate by 5.5%.
- Key result: Increase audience size on paid social campaigns incrementally by 2.5%.
- Key result: Maintain engagement rate of 5.4%.
- Key result: Maintain social CTRs and conversion rates.
With this objective, we want to increase our audience across organic and paid campaigns without losing relevance or allowing engagement to suffer, as a result. Essentially, we want to maximise reach within our target audience but stop before we reach the point of diluting the impact of our message - especially on paid campaigns where wasted ad spend will hurt ROAS.
So we have to pay close attention to engagement metrics, clicks and conversion rates to ensure we’re not expanding our audience too far.
28Improve the reach of organic posts
Increasing followers is a great way to build a larger social media audience but, on platforms that offer organic reach, the majority of impressions should come from non-followers.
Bearing in mind that your social audience includes all of the people who could see your messages, improving the reach of your organic posts is one of the most important strategies for building a larger audience.
According to data from Influencermarketinghub.com, you can expect the following average organic reach on Facebook, Instagram, Twitter and LinkedIn:
- Facebook: 5.2%
- Instagram: 20%
- Twitter: 3.61%
- LinkedIn: 13%
Obviously, we’re not going to set average targets in our social media campaigns so we might define the following OKR for improving the reach of organic posts:
- Objective: Increase average reach across networks to ≤13.25%.
- Key result: Increase avg. Facebook reach to ≤8%.
- Key result: Increase avg. Instagram reach to ≤25%.
- Key result: Increase avg. Twitter reach to ≤5%.
- Key result: Increase avg. LinkedIn reach to ≤15%.
- Key result: Maintain avg. engagement rate of 5.4%.
Once again, we want to increase the reach of organic posts but we don’t want to extend ourselves too far to the point where we started reaching less relevant people. So we want to keep an eye on engagement metrics and maintain an avg. engagement rate of 5.4% across all platforms.
29Improve social engagement
As mentioned in the previous example, unengaged social media followers add little value to your marketing strategy. Sure, it’s nice to have a high follower count on your accounts and you might find high figures help increase the perceived legitimacy of your brand but it’s always suspicious when brands with millions of followers only get a few likes on their posts.
We’re more interested in building meaningful relationships with social followers so, even if you’ve only got fewer than 5,000 followers on each network, you might set an OKR that prioritises high engagement:
- Objective: Improve social engagement on Facebook, Twitter and LinkedIn.
- Key result: Average engagement rate of 11.1% (tracked in Hootsuite).
- Key result: Average applause rate of 7.5% (tracked in Hootsuite).
- Key result: Average ≥250 likes per post.
- Key result: Average ≥75 shares per post.
- Key result: Average ≥30 comments per post.
- Key result: Average 1.5% CTR per post.
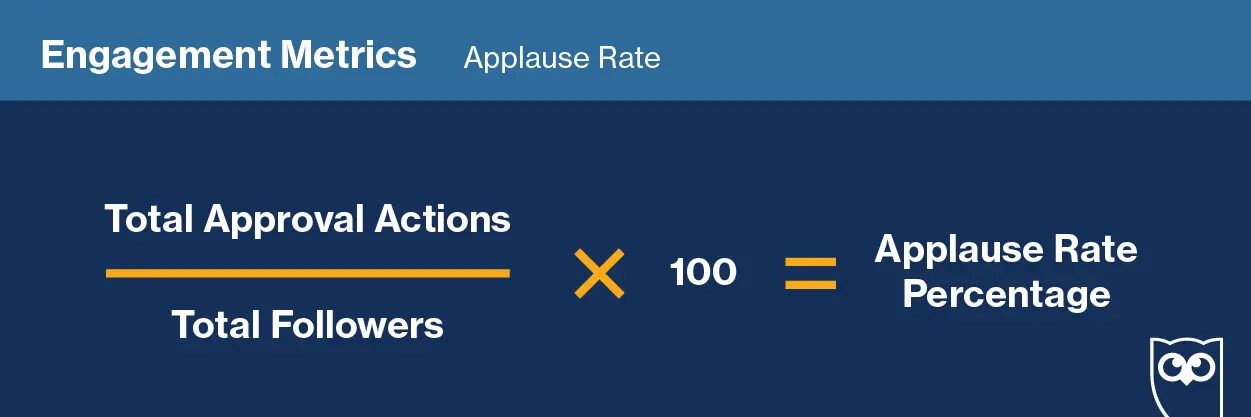
Applause rate is another metric you can track in Hootsuite and some other social media analytics tools. The metric takes all of the positive interactions for a post (likes, shares, etc.), divides them by the number of followers you have and multiplies the resulting figure by 100.
Source: Hootsuite
So, if your post gets 250 likes and 75 shares (based on the OKR above), your total approval actions would be 225. Now, if you’ve got 3,000 followers on the social account in question, the applause rate calculation would divide 225 by 3,000 (0.075) and multiply by 100 to give us an applause rate percentage of 7.5%.
30Increase brand mentions
Brand mentions tell you how much people are talking about your brand and they’re a good measure of impact following important announcements, campaign launches, product releases, PR issues and anything else that might encourage people to talk about you online.
By itself, brand mentions as a metric doesn’t tell you what people are saying about you (positive or negative) but it is an effective way to gauge the response to messages you expect to make an impact. For example, you would expect to see a gradual increase in brand mentions as marketing campaigns progress for the launch of a new product.
Let’s stick with this idea as we look at an example OKR:
- Objective: Increase brand mentions by 30% ahead of product launch.
- Key result: Average engagement rate of 16.65%.
- Key result: Average applause rate of 11.25%.
- Key result: Increase average likes by ≥50% per post.
- Key result: Increase average shares by 35% per post.
- Key result: Increase average comments by ≥65% per post.
- Key result: Increase audience growth rate by 25%.
- Key result: Achieve OKR by 3 months ahead of launch date.
Here, we’re setting the primary objective of increasing brand mentions in the build-up to the launch of a new product but we’re also tracking other metrics to gauge the positive impact of these mentions. We’ve set targets for improved engagement and applause rates, as well as specific engagements (likes, shares and comments) to ensure brand mentions correlate with engagement.
We also want to see brand mentions translate into audience growth because our marketing campaigns are designed to generate hype among our existing followers but also a wider group of people.
31Increase social click-through rates
Getting back to the topic of social media engagement, click-through rate (CTR) is one of the most important indicators that your social strategy is capturing people’s interest. Users aren’t simply seeing your social media posts, they’re clicking through to access more content and - in most cases - visiting your website where you have the opportunity to convert them into valuable leads.
According to data from Hootsuite, the average CTR for paid campaigns is little more than 1% and organic CTRs can vary greatly, depending on the network, post type, content and relevance of your audience.
For example, organic clicks are especially hard to earn on Facebook but we’ve found news stories and data studies can attract some of the highest CTRs on Twitter.
Based on this, our OKR for increasing social click-through rates could look something along these lines:
- Objective: Increase average social CTRs to 1.52% across all networks.
- Key result: Increase average social ad CTRs to 1.35%.
- Key result: Increase organic social CTRs to 1.7%.
- Key result: Increase Twitter CTRs to 2.2%.
- Key result: Increase Facebook CTRs to 0.8%.
- Key result: Maintain avg. organic reach of ≥5K.
- Key result: Maintain avg. paid reach of ≥12K.
- Key result: Maintain paid conversion rate of ≤4.8%.
With this OKR, we’re setting specific targets for paid and organic CTRs across each network (we could have added targets for LinkedIn and other networks). We’re also setting key results for organic and paid reach to make sure we don’t over-optimise for clicks and reduce our reach to the point fewer people see our message.
Finally, we’re also specifying that average conversion rates across networks should remain at a minimum of 4.8% to ensure our efforts to increase CTRs doesn’t negatively impact conversion in any way. In theory, conversion rates should more likely increase than decrease as CTRs improve (unless we’re doing something wrong) but our priority, for now, is to try and maximise CTRs without harming reach, engagement or conversions.
Once we’ve got enough data from this campaign, we can start to make informed decisions about how CTRs impact conversion rates.
32Increase social conversion rates
Social media is a mixed bag when it comes to conversion rates and you can see this from the average conversion rates of advertising campaigns across the major networks:
When you consider the average conversion rates for Google Ads and Microsoft Advertising campaigns are 3.75% and 2.94% respectively, you see how varied social conversion rates can be. Keep in mind, conversions aren’t the only goal in social media marketing and there’s value in Instagram’s organic reach (20% vs Facebook’s 5.2%), Twitter’s ability to promote content and LinkedIn’s connections with business decision-makers.
Also, we have to remember that conversion rates don’t tell us anything about conversion value, which means higher conversion rates don’t always relate to higher revenue. LinkedIn is a perfect example of this, where you can specifically target big-spending companies and generate significantly more revenue from one conversion than you would get from hundreds on Facebook.
Our OKR for increasing social conversion rates takes all of this into consideration.
- Objective: Increase social conversion rates by 30%.
- Key result: Facebook conversion rate of 12%.
- Key result: Twitter conversion rate of 1%.
- Key result: LinkedIn conversion rate of 3%.
- Key result: Annual revenue from Facebook Ads: $96,000.
- Key result: Annual revenue from Twitter Ads: $32,000.
- Key result: Annual revenue from LinkedIn Ads: $180,000.
With this OKR, we’re ensuring that higher conversion rates result in more annual revenue and we could also set targets for avg. conversion value for each network and target returns on ad spend (ROAS) to help us keep track of performance on a month-by-month basis.
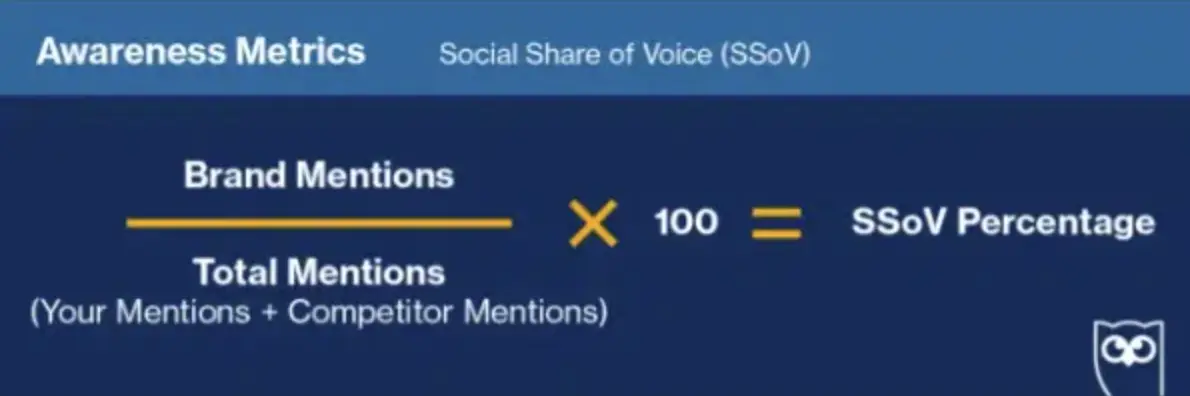
33Increase social share of voice
Social share of voice (SSoV) measures how many people are talking about your brand in relation to your competitors. Essentially, it divides your brand mentions by the total brand mentions for you and your competitors at any one time.
Hootsuite is a great tool for tracking this and it also offers up this handy visualisation for the SSoV calculation:
Earlier, we looked at an OKR for increasing brand mentions ahead of a product launch where we would want more people to be talking about our brand. The OKR also specified key results for engagement to ensure mentions were translating to positive interactions and we want to take a similar approach to increasing our social share of voice:
- Objective: Increase social share of voice by 30%.
- Key result: Average engagement rate of 16.65%.
- Key result: Average applause rate of 11.25%.
- Key result: Increase average likes by ≥50% per post.
- Key result: Increase average shares by 35% per post.
- Key result: Increase average comments by ≥65% per post.
- Key result: Increase audience growth rate by 25%.
By tracking engagement metrics alongside social share of voice, you’re better positioned to distinguish between positive and negative brand mentions - both of which can impact SSoV. After all, you want to be getting more attention than your competitors, but for the right reasons.
34Generate sales through influencer marketing
The phrase influencer tends to conjure images of Instagram models travelling around the world, asking for free hotel rooms in exchange for “exposure”. But influencer marketing is far bigger than Instagram and, regardless of which industry you’re in, there are people on Twitter, LinkedIn, YouTube and every other platform who influence the buying decisions of your target audience.
So let’s imagine we’re launching an influencer marketing campaign with a prominent software review publisher ahead of our next product launch.
Here’s our example OKR:
- Objective: Sell 30 annual contracts in the first month of release via affiliate sales from a YouTube review published by our partner influencer.
- Key result: Generate $105,000+ revenue from 30 annual contracts at $299/month.
- Key result: Organic reach of ≥3,500 in the first month.
- Key result: Conversion rate of 3% in the first month.
- Key result: Sign up 105 users to 14-day free trials from YouTube review in the first month.
- Key result: Convert 30 free trial users attributed to the campaign into annual contract buyers (28.57%).
With this OKR, we’re setting specific revenue targets and calculating exactly what this requires in terms of reach, conversion and upgrades from free trials to annual contracts.
Email marketing goals & OKRs
In this section, we’re looking at the following email marketing goals and OKRs:
- Increase email signups
- Increase delivery rate
- Boost email open rate
- Improve email CTRs
- Increase email conversions
- Reduce unsubscribe rate
- Improve list growth rate
- Increase nurture email actions
With these goals, the aim is to maximise email lead capture and the performance of email marketing campaigns.
35Increase email signups
The best email marketing strategies capture leads at every stage of the consumer journey and some of these opportunities are more valuable than others. So it’s not meaningful to simply say you’re going to increase email signups without setting specific targets for each type of lead - something along the lines of this:
- Objective: Increase signups to email nurturing campaigns by 30%.
- Key result: Capture ≥1,500 email newsletter signups per month.
- Key result: Capture ≥500 leads from gated content per month.
- Key result: Convert ≥150 visitors into free trial signups per month.
We’re setting specific targets for email newsletter signups, leads from gated downloadable content (eg: evergreen guides) and a key result for the number of website visitors we want to convert into free trial users every month.
36Increase delivery rate
Delivery rate measures the amount of your outbound emails that successfully reach the intended recipient. More specifically, it calculates the percentage of emails that land in the recipients’ inboxes vs email bounces - either because the email address is invalid or doesn’t exist any longer (hard bounce) or a temporary issues (soft bounce), such as your email being too large, the recipient having insufficient server space available of the server being down.
Email delivery rate is calculated with the following equation:
Delivery rate = [(sent emails - bounced emails) / sent emails] x 100
Internet service providers (ISPs) may direct your emails to junk folders or block them altogether if your emails bounce too often so delivery rate is definitely something you want to optimise.
- Objective: Increase delivery rate to ≥90%.
- Key result: Reduce email bounce rate to 3%.
- Key result: Reduce email spam rate to 0.1%.
With this OKR, we’re setting the objective of reaching our target delivery rate but we’re also identifying two key metrics that will help us achieve this. As we can see from the delivery rate calculation, bounce rates play a key role so we also need to optimise our systems to minimise bounce rates and our email relevance, titles and content to minimise spam flags.
37Boost email open rates
Once you know your emails are reaching your intended recipients, open rates is the first metric that deserves your attention. This tells you people aren’t only receiving your emails but clicking through to them to find out more information - in other words, your email subject lines and preview text are capturing the interest of your audience.
According to data from SuperOffice, the average open rates vary significantly across countries so you’ll have to keep this in mind as you set targets:
If we’re looking to maximise email open rates, we might set something like this for an OKR:
- Objective: Increase email open rate to ≥27%.
- Key result: Open rate of ≥18% for the UK.
- Key result: Open rate of ≥30% for Germany.
- Key result: Open rate of ≥35% for Denmark.
- Key result: Increase delivery rate to ≥90%.
- Key result: Reduce email bounce rate to 3%.
- Key result: Reduce email spam rate to 0.1%.
Let’s assume we’re targeting three key markets (the UK, Denmark and Germany) so we’ve set specific email open rate targets for each country and used this to set our average objective of ≥27%. Also, we want to make sure we’re keeping delivery rates where they need to be as we optimise for opens so we’re including these key results to ensure we’re hitting the right level of reach and engagement.
38Improve email CTRs
Once users open your emails, you want them to engage with your content and, then, click through to your website to find out more information or complete your call to action. Your email click-through rate (CTR) measures the percentage of users who click an element in your email that takes them to your website.
For the previous OKR, we looked at data from SuperOffice showing the average email open and click-through rates for different countries. Much like open rates, the average click-through rate varies greatly between countries - here’s a quick reminder:
Based on this, we can set the following OKR:
- Objective: Increase email CTRs to ≥22.5%.
- Key result: CTR of ≥15% for the UK.
- Key result: CTR of ≥28% for Germany.
- Key result: CTR of ≥25% for Denmark.
- Key result: Maintain email open rate of ≥27%.
Once again, we’re setting specific targets for each key market and using these figures to define a realistic objective for the OKR. We’re also setting a key result to maintain our average open rate target of ≥27% across all markets because we need users to open our emails before they can click through from them.
39Increase email conversions
Email conversion rate measures the percentage of users who complete a conversion action after clicking through from one of your emails. According to ActiveCampaign, the average email conversion rate in 2026 was ~20% and you should see significantly higher percentages than conversion rates from other channels, such as PPC and social media campaigns.
This is because your email campaigns are highly targeted and you’ve already convinced users to take several actions before getting to this point (sign up, open your email, take in the message, click through to your website, etc.). So, on average, your email traffic is coming in with a much higher purchase intent and motivation to take action, which should reflect in your conversion rates.
Here’s what our OKR could look like:
- Objective: Increase email conversion rates to ≥25%.
- Key result: Email CTR of ≥22.5%.
- Key result: Email open rate of ≥27%.
- Key result: Email delivery rate of ≥90%.
- Key result: Email bounce rate of ≤3%.
As with previous goals, we’re setting the same targets for the metrics and KPIs that will help us achieve our primary objective. To hit our target conversion rate, we need to reach and maintain our target deliveries, opens and CTRs without weakening the quality and relevance of leads on our email marketing lists.
40Reduce email unsubscribe rate
Unsubscribe rates tell you the percentage of email subscribers who are taking the action to remove themselves from your list over any given period. This is calculated by dividing the total number of unsubscribes during a defined period by the number of emails sent - and multiplying the resulting number by 100.
Unsubscribe rate = (emails sent / total unsubscribes) x 100
So, if you send 10,000 emails per month and 30 people unsubscribed last month, your unsubscribe rate would be 30/10,000 (0.003) x 100 = 0.3%.
According to Campaign Monitor, a 0.3% unsubscribe rate would put you above the average of 0.17% so let’s set an OKR to try and bring this down.
- Objective: Reduce unsubscribe rate to ≥0.15%.
- Key result: Email open rate of ≥27%.
- Key result: Email CTR of ≥22.5%.
- Key result: Email conversion rate of ≥25%.
- Key result: Avg. time spent viewing emails: ≥15s.
People who unsubscribe from email lists have decided your messages are no longer of interest (or never were) and they would rather stop receiving them altogether. So, to reduce unsubscribe rates, you have to improve the relevance of your email marketing leads and the messages you’re sending them. Next, you have to optimise for engagement and this is the focus of our OKR where we target open rates, CTRs, conversions and avg. time spent viewing emails as indicators that your messages are being received as you intend them.
41Improve list growth rate
Email list growth rate aims to measure how quickly your email list is growing, taking into consideration the number of new subscribers and the people who unsubscribe over any given period.
The calculation should look something like this:
List growth rate = [(new subscribers - unsubscribes) / list contacts] x 100
So, let’s say you’ve got 500 new subscribers for the month but you also lost 50 subscribers, giving you a total of 10,000 contacts on your list. You would subtract 50 from 500 to get 450, divide this by 10,000 to get 0.045 and then multiply by 100 to get a list growth rate of 4.5%.
So let’s define an OKR to improve this figure:
- Objective: Increase list growth rate to ≥6%.
- Key result: Increase monthly email leads to 630+.
- Key result: Reduce monthly unsubscribes to ≤30.
- Key result: Reduce unsubscribe rate to ≥0.15%.
- Key result: Email open rate of ≥27%.
- Key result: Email CTR of ≥22.5%.
- Key result: Email conversion rate of ≥25%.
- Key result: Avg. time spent viewing emails: ≥15s.
Here, we’re defining specific lead generation targets to increase the number of email leads captured each month. In the last OKR, we set an objective to reduce unsubscribe rates to ≤0.15% and this would mean losing no more than 30 subscribers in the first month (the calculation will change each month as the total number of subscribers increases).
42Increase nurture email actions
Lead nurture email campaigns are designed to guide prospects across the buying process through a series of actions, building up to the next conversion. These actions could include visiting a specific sequence of pages, creating a free user account, accessing a voucher code, using certain features in your software, etc. - some of which may be conversions in themselves, but not necessarily all of them.
In email lead nurturing, you can use these actions as triggers to move prospects from one email list to another, targeting them with relevant messages at each stage of the funnel. To increase the percentage of actions attributed to your lead nurture email campaigns, you might define the following OKR:
- Objective: Increase action completion rate (actions attributed to email campaigns) by ≥5%.
- Key result: Email delivery rate of ≥90%.
- Key result: Email bounce rate of ≤3%.
- Key result: Email open rate of ≥27%.
- Key result: Email CTR of ≥22.5%.
- Key result: Email conversion rate of ≥25%.
- Key result: Avg. time spent viewing emails: ≥15s.
By accessing the OKRs and key results in our other email optimisation campaigns, we can determine that a 5% increase in action completions is achievable if we achieve the other key results listed above and optimise the post-click experience to reduce friction and increase motivation for each target action.
Lead generation / nurturing goals & OKRs
In this section, we’re looking at the following lead generation/lead nurturing goals and OKRs:
- Increase leads
- Improve lead quality
- Diversify lead sources
- Generate more MQLs & SQLs
- Reduce cost per MQL/SQL
- Increase funnel progressions
- Improve lead closure rate
- Reduce lead response time
These goals will turn more prospects into paying customers while improving the efficiency and profitability of your sales processes.
43Increase leads
Increasing leads is one of the most common inbound marketing goals but always have to consider other factors, such as lead quality, the cost of leads in question and how many leads you have the capacity to manage.
So our OKR for this might include the following:
- Objective: Increase monthly leads +30% by end of Q.
- Key result: Average lead score of ≥6.8/10.
- Key result: 10% of lead scores ≥9/10.
- Key result: 25% of lead scores ≥8/10.
- Key result: 50% of lead scores ≥7/10.
With this OKR, we’re not only looking at total lead volume but taking a calculated approach to ensuring we generate the right quality of leads.
44Improve lead quality
Based on the calculations we ran for the previous OKR, we can set the following for improving the overall quality of leads:
- Objective: Increase average lead score to ≥6.8/10.
- Key result: 10% of lead scores ≥9/10.
- Key result: 25% of lead scores ≥8/10.
- Key result: 50% of lead scores ≥7/10.
- Key result: Generate 500+ leads per month meeting our minimum quality requirements.
ActiveCampaign is one of the best platforms for calculating the quality of leads throughout the sales process. The platform uses intelligent automation to score leads as they progress through your funnels, not only allowing you to measure lead quality but also prioritise the most valuable prospects.
This feature is one of the main reasons we still use ActiveCampaign as our all-in-one CRM, email marketing and marketing automation system. If you want to find out more about ActiveCampaign specifically, take a look at our in-depth review which is regularly updated to reflect our experience after 5+ years using the system.
45Diversify lead sources
If you’re looking to increase leads, one of the most effective strategies is to diversify your lead sources because this connects you with audiences you might not be able to reach on your existing channels.
So we might set out the following OKR:
- Objective: Generate more leads by diversifying lead sources - without reducing quality.
- Key result: Generate 100+ monthly leads from Instagram (a new channel).
- Key result: Generate 100+ monthly leads from YouTube (a new channel).
- Key result: Maintain average lead score of ≥6.8/10.
In this case, we’re testing out two new platforms to generate leads and setting relatively modest targets for lead volume because our priority is to generate more leads while maintaining average lead scores. Once we’ve started making progress on these channels, we can start to put more ambitious lead generation targets in place for the specific platforms.
46Generate more MQLs & SQLs
Marketing qualified leads (MQLs) and sales qualified leads (SQLs) are the leads that meet your minimum requirements for dedicating additional resources to - so that you can try and close the deal. Essentially, these leads need to show enough potential that they can materialise into sales and also meet the requirements you define for suitable customers - budget, expected lifetime value, buyer persona match, etc.
We’ve covered this topic in plenty of detail before and you can take a look at the following articles if you want more information about MQLs and SQLs:
By capturing more qualified leads, you’re generating a higher volume of profitable business opportunities and increasing the percentage of leads that pass your MQL and SQL criteria, the more effective your marketing strategy becomes.
So we might define an OKR along the lines of this:
- Objective: Generate more MQLs and SQLs per month.
- Key result: Increase qualified leads +30% by end of Q4.
- Key result: Generate 600 monthly MQLs.
- Key result: Secure 135 monthly SQLs.
- Key result: Maintain lead closure rate of 27%.
Once again, we’re looking to increase the volume of MQLs and SQLs but we don’t want to capture more prospects at the expense of losing quality and, ultimately, generating less revenue. We want to maintain lead quality and our target closure rate of 27% from SQLs so we’re genuinely driving growth with our lead generation strategy.
47Reduce cost per MQL/SQL
Another issue you’ll often experience with increasing MQLs and SQLs is increased costs per lead. Let’s be clear, paying more for leads that generate more revenue is a great way to drive growth (provided the profitability is right) so we’re not suggesting you should try to lower the cost of MQLs/SQLs as a default practice - in many cases, this is counterintuitive.
However, there comes a point where continuing to increase the value of leads stretches your budget too far and you have to look into strategies for reducing your cost per lead without compromising quality (or, more accurately, revenue and profit).
So we might set the following OKR for this:
- Objective: Reduce cost per MQL/SQL by 5%.
- Key result: Increase percentage of MQLs/SQLs by 15%.
- Key result: 10% of lead scores ≥9/10.
- Key result: 25% of lead scores ≥8/10.
- Key result: 50% of lead scores ≥7/10.
- Key result: Maintain lead closure rate of 27%.
By increasing the percentage of leads that qualify for marketing and sales, we spend less of our marketing budget on unsuitable leads while also increasing the volume of business opportunities and potential profitability. Essentially, we’re generating a higher percentage of MQLs and SQLs on the same budget, which drives down our cost per lead.
As long we maintain our lead quality targets and closure rate, this translates into lower CPLs and higher revenue.
48Increase funnel progressions
Funnel progressions describe instances where prospects move from one stage of the marketing/sales funnel to the next, taking them one step closer to making their next purchase. The more of these progressions you can achieve, the more leads you’ll convert into paying customers and repeat buyers.
Here’s a look at our example OKR:
- Objective: Increase average funnel progressions per lead by 35%.
- Key result: Average funnel progressions per lead of ≥8.
- Key result: Average lead score of ≥6.8/10.
- Key result: Maintain lead closure rate of 27%.
- Key result: Customer retention rate of 90%.
Funnel progressions aren’t an official metric, this is just what we’re calling actions that move leads from one stage of the buying process to the next for the purposes of this article. To track these, you’ll need to use a platform like Google Analytics that allows you to track custom events (page visits, CTA clicks, video views, etc.).
49Improve lead closure rate
Lead closure rate (or close rate) measures the percentage of qualified leads you convert into paying customers. For the last goal, we defined a key result to maintain a lead closure rate of 27% so let’s look at a potential OKR for increasing this:
- Objective: Increase lead closure rate to 32%.
- Key result: Reduce lead response time by 45%.
- Key result: Maintain avg. deal value of ≥$3,500/yr.
- Key result: Maintain avg. customer lifetime value of ≥$22,000.
- Key result: Increase annual revenue to ≥$472,500.
With this OKR, we’re making sure our campaigns not only increase lead closure rates but maintain average deal values and customer lifetime values. This is because we want to ensure that closing more deals generates more revenue and avoid falling into the trap of closing a higher volume of lower-value deals.
50Reduce lead response time
For the last OKR, we also defined a key result for reducing lead response time as this is one of the most important metrics to optimise when you want to increase your lead closure rate. So let’s turn our attention to lead response times and how we might approach reducing them:
- Objective: Reduce lead response time by 45%.
- Key result: Avg. lead response time of three minutes.
- Key result: Automated email response time of 30s.
- Key result: Manual email response time to high-value leads of ≥5 minutes.
- Key result: Phone call response time to high-value leads of ≥5 minutes.
- Key result: Lead closure rate of 32%.
When optimising lead response times, you have to make sure you continue to prioritise your most important leads. Earlier, we talked about lead scoring and we can use the same technique to make sure we’re responding to our most important customers first.
Conversion optimisation goals & OKRs
In this section, we’re looking at the following conversion optimisation goals and OKRs:
- Increase total conversions
- Increase conversion rate
- Increase avg. conversion value
- Reduce cost-per-action
- Reduce time to convert
- Increase form completions
- Reduce lead dropouts
- Maximise onboarding rate
The aim is to maximise the volume of users that convert into leads or customers while optimising strategies to increase the value of prospects and reduce the cost of acquiring them.
51Increase total conversions
Conversion rates get a lot of attention in marketing discussions but a 90% conversion rate is nothing to brag about if you’re only converting a few leads while your competitors are hitting dozens, hundreds or more total conversions every month.
So let’s take a look at an OKR for increasing total conversions:
- Objective: Increase total conversions by 30%.
- Key result: Increase avg. sales conversions to ≥300 per month (free trials, demos, purchases, upgrades, etc.).
- Key result: Maintain avg. deal value of ≥$3,500/yr.
- Key result: Maintain avg. customer lifetime value of ≥$22,000.
- Key result: Increase annual revenue to ≥$472,500.
So our objective is to increase total conversions by 30% but we’re acknowledging that not all conversions are equal and setting a minimum target for sales conversions that generate revenue. We also have to pay attention to conversion value to ensure that increasing total conversions generates additional revenue.
52Increase conversion rate
Optimising conversion rates alongside total conversions is a great way to maximise sales while also optimising the efficiency of your marketing and sales strategies. Effective marketing and sales processes will convert a high percentage of leads into paying customers and this is where conversion rates are so important - as long as we pay attention to profitability metrics:
- Objective: Increase conversion rates by 5%.
- Key result: Avg. conversion rate of 12%.
- Key result: Avg. sales conversions of ≥300 per month.
- Key result: Maintain avg. deal value of ≥$3,500/yr.
- Key result: Maintain avg. customer lifetime value of ≥$22,000.
- Key result: Increase annual revenue to ≥$472,500.
Once again, we need to pay attention to total conversions, the value of conversions and revenue to prevent conversion rate becoming a vanity metric.
53Increase avg. conversion value
The higher your average conversion value, the more revenue you’re generating from each marketing action. Provided you can maintain total conversions, increasing conversion value is a key strategy for maximising ROI, independently from growth.
Here’s what our OKR could look like:
- Objective: Increase average conversion value by 30%.
- Key result: Increase avg. deal value to ≥$4,550/yr.
- Key result: Increase avg. customer lifetime value to $≥$28,000.
- Key result: Increase annual revenue to ≥$614,250.
- Key result: Avg. sales conversions of ≥300 per month.
- Key result: Maintain minimum avg. conversion rate of 12%.
Here, you can see we’re specifying targets for average deal value, customer lifetime value and annual revenue - as well as maintaining sales conversions and conversion rates - to make our marketing and sales processes more profitable.
54Reduce cost-per-action
Cost-per-action (CPA) is often used interchangeably with cost-per-acquisition but these are two different metrics. Traditionally, cost-per-action is an advertising metric used to calculate how much you’re paying - on average - for each action of value.
This includes conversions, acquisitions (sales) and any other action you consider valuable enough to spend money on - eg: the funnel progression actions we looked at in example #48.
So, instead of simply calculating the average cost of securing paying customers (cost-per-acquisition), cost-per-action provides a more rounded figure of what you’re paying to secure valuable actions, making it a powerful metric for measuring the profitability of marketing strategies across the entire funnel.
Now, let’s take a look at our example OKR:
- Objective: Reduce cost-per-action by 15%.
- Key result: Maintain funnel progressions per lead of ≥8.
- Key result: Average lead score of ≥6.8/10.
- Key result: Maintain lead closure rate of 27%.
- Key result: Avg. deal value of ≥$3,500/yr.
- Key result: Avg. customer lifetime value of ≥$22,000.
- Key result: Increase annual revenue to ≥$472,500.
As with all of our action and conversion-oriented OKRs, we’re setting targets for conversion values, closure rates, revenue and everything else we need to ensure that reducing cost-per-action doesn’t negatively impact sales, growth or profit. This is especially important when you define any goal or objective for reducing marketing expenses because you want to maintain or increase the returns while gradually reducing costs to improve ROI.
55Reduce time to convert
Time to convert (or time to conversion) simply measures the period between users’ entry into your marketing/sales funnels and the moment they convert. In Google Ads, this is called Days to conversion and you may find other variations for the same metric on other platforms.
Let’s say it currently takes you 45 days, on average, to convert a lead into a free trial user or paying customer and you want to reduce this to 30 days with the following OKR:
- Objective: Reduce avg. time to convert by 33%.
- Key result: Avg. time to convert ≤30 days.
- Key result: Increase avg. sales conversions to ≥320 per month.
- Key result: Avg. deal value of ≥$3,500/yr.
- Key result: Avg. customer lifetime value of ≥$22,000.
- Key result: Increase annual revenue to ≥$504,000.
For this OKR, we’re defining a hypothesis that predicts reducing avg. time to convert will increase the percentage of deals successfully closed, increasing avg. monthly sales conversions of 320. Provided we ensure the average deal value stays the same (or improves), this will increase annual revenue to $504,000 or more.
56Increase form completions
Almost every conversion goal you’re targeting in your marketing and sales strategies require users to complete some kind of form - eg: sign up to an email list, create an account, pay for a product, etc. Which means optimising form completions is one of the most important activities in your CRO strategy.
Here’s our example OKR:
- Objective: Increase form completions by 15%.
- Key result: Reduce submission errors by 30%.
- Key result: Reduce avg. time to complete ≤1.5 minutes.
- Key result: Increase conversion rates by 5%.
- Key result: Avg. conversion rate of 12%.
- Key result: Avg. sales conversions of ≥300 per month.
- Key results: Avg. deal value of ≥$3,500/yr.
To increase form completions, we might determine that submission errors are an issue and target reduced completion times as we optimise our forms. We’re also setting targets for conversion rates and total conversion because both should increase as form completions rise.
Once again, we need to set targets for deal value or conversion value to make sure we’re converting more of the right customer, not simply a higher volume of lower-value deals.
57Reduce lead dropouts
Lead dropouts are inevitable across the marketing and sales funnel but there are plenty of things we can do to reduce the volume of leads slipping through gaps. In fact, we’ve covered this topic in plenty of detail and you might want to take a look at the following articles:
- Funnel Optimisation 101: 5 Steps to Fixing a Leaky Marketing Funnel
- Marketing Funnel Strategies: 5 Steps to Increasing Sales
You can track funnel dropouts in Google Analytics and many funnel analysis tools to identify leaks and test solutions.
- Objective: Reduce funnel dropouts by 30%.
- Key result: Increase conversion rates by 5%.
- Key result: Avg. conversion rate of 12%.
- Key result: Avg. time to convert ≤30 days.
- Key result: Increase checkout page completions by 15%.
- Key result: Increase onboarding completions by 30%.
- Key result: Increase customer retention by 5%.
With the right funnel analysis insights, we can specify targets for everything we’ve identified as potential issues and decided to test - in this case, checkout page completions, onboarding completions and customer retention.
58Maximise onboarding completion rate
If selling your products or services involves any kind of onboarding process (account setups, system updates, hardware installations, software downloads, etc.), then each step of this process is a potential cause for users to drop out of your funnel at the final hurdle.
If onboarding takes place after the initial conversion/payment, you may have to dig a little deeper to find the implication of poor experiences and failed completions during the onboarding process. For example, they might reduce software usage, engagement, renewals and upgrades while increasing the risk of cancellations and churn.
- Objective: Increase onboarding completion rate by 30%.
- Key result: Increase first-month engagement rate by 12%.
- Key result: Increase free trial upgrades to 32%.
- Key result: Reduce time to value (TTV) to ≤1 hr.
- Key result: Increase customer retention by 5%.
By optimising onboarding completions, a higher percentage of prospects will start using your product. From here, you can target increased engagement during the first month of usage, a higher percentage of free trial upgrades and other KPIs that not only seals the first paid conversion but also increases your chances of retention and recurring revenue.
User experience goals & OKRs
In this section, we’re looking at the following user experience goals and OKRs:
- Increase session time
- Increase avg. pages per session
- Reduce bounce rates
- Increase avg. time on page
- Reduce loading times
- Increase adoption rate
- Increase actions per session
- Reduce time between actions
By optimising the user experience to maximise engagement, you can increase the impact of your marketing messages and the incentive users have to take action at the key moments.
59Increase session time
Avg. session time tells you how long users spend on your website or product each session, on average. While you have to be a little careful about reading too much into this metric for web traffic, it’s a useful indicator of engagement and even more important for software sessions.
So let’s focus on software sessions for this OKR:
- Objective: Increase avg. session time by 25%.
- Key result: Avg. session time of ≥3hrs.
- Key result: Increase avg. sessions per week by 30%.
- Key result: Increase avg. key actions per session to ≥10.
- Key result: Reduce time between key actions by 15%.
With average session time, quantity doesn’t always represent quality and you want to know more time spent on your site/in your software means users are completing a higher quantity of valuable actions. So we’re also optimising to increase the average number of key actions per session and reduce the time between valuable actions.
60Increase avg. pages per session
Pages per session measures the average number of pages a user visits in a session and it can be a useful metric for tracking engagement.
- Objective: Increase avg. pages per session by 25%.
- Key result: Increase avg. time per session by 30%.
- Key result: Increase avg. key actions per session by 5%.
- Key result: Increase conversion rate by 1.5%.
Much like session time/duration, increasing pages per session by itself doesn’t necessarily mean you’ve improved the experience or user engagement; you have to analyse this alongside other engagement metrics.
61Reduce bounce rates
We’ve used bounce rate as a metric in several of our OKRs already (eg: Maximising page views) and discussed email bounce rates specifically. For this OKR, we’re looking to reduce bounce rate as a means of improving engagement and valuable actions.
- Objective: Reduce bounce rate by 25%.
- Key result: Avg. bounce rate of ≤50% across all pages.
- Key result: Avg. bounce rate of ≤30% for landing pages.
- Key result: Avg. bounce rate of ≤70% for blog posts.
- Key result: Increase avg. pages per session by 25%.
- Key result: Increase avg. time per session by 30%.
- Key result: Increase avg. key actions per session by 5%.
- Key result: Increase conversion rate by 1.5%.
Like many of the metrics we’re looking at in this section, bounce rate by itself doesn’t tell you much about the quality of user experience unless you look at other metrics - including page visits per session, avg. time per session and important actions, such as conversions.
62Increase avg. time on page
At the page level, measuring the average time users spend on important pages is a solid way to judge the quality of engagement, especially if you can turn increased avg. time on page into increased conversions or other valuable actions.
- Objective: Increase avg. time on page by 25%.
- Key result: Increase avg. time on page for key pages by 35%.
- Key result: Increase avg. key actions per session by 5%.
- Key result: Increase conversion rate by 1.5%.
If users are spending more time on your most important pages, this should mean a cohort is engaging with your content/message on a deeper level. By extension, you would hope to see an increase in valuable actions per session and your average conversion rate.
63Reduce loading times
Loading times are one of the most important factors in UX performance and a bunch of studies have found slow loading times to be one of the top conversion killers. Poor loading times will also affect your organic search ranking because search engines like Google want to deliver quality experiences, as well as content.
So here’s our example OKR for reducing loading times:
- Objective: Reduce loading times by 30%.
- Key result: Reduce loading times on important pages by ≥35%.
- Key result: Increase traffic from organic search by ≤5%.
- Key result: Reduce bounce rate by 10%.
- Key result: Increase avg. time per session by 15%.
- Key result: Increase conversion rate by 1.5%.
We’ve set an average reduction target for the whole website and a more ambitious target for key pages, such as landing pages, product pages, etc. We also want to see an increase in organic traffic from improved loading times (especially on mobile) with a reduction in bounce rates, as well as increased avg. time per session and - most importantly - higher conversion rates.
64Increase adoption rate
Adoption rate tracks the percentage of customers/users who start using a product or feature (or continue doing so) at a key moment. This can include users who keep using your product after their free trial ends, adopt a new feature you’ve released, renew their subscription at the end of their contract and any other instance where prospects or customers decide whether or not to “adopt” any of your products or features.
Based on this, we could define an OKR for increasing adoption rate:
- Objective: Increase adoption rate by 22%.
- Key result: Free-to-paid user adoption rate of ≥35%
- Key result: New feature adoption rate of ≥60%.
- Key result: New product adoption rate of ≥28%.
- Key result: Upselling rate of ≥24%.
- Key result: Customer retention rate of 90%.
With this OKR, we’re setting a primary objective of increasing adoption rates across the board and also defining specific targets for each type of adoption that’s important to us (free-to-paid upgrades, feature adoption, new product adoption, upselling and retention rates).
65Increase actions per session
We’ve discussed actions in several examples already, in reference to any user actions you deem valuable. This could include page visits, page sequences, video play button clicks, email signups, product purchases and any action that indicates valuable engagement and/or progression towards the next conversion.
In software, this could also include any in-app action that contributes to engagement, stickiness or customer value.
Let’s take a look at an example OKR for a software product:
- Objective: Increase key actions per session by 33%.
- Key result: Avg. key actions per session of ≥11.
- Key result: Avg. session duration of ≥3 hrs.
- Key result: Reduce time between key actions by 5%.
- Key result: Reduce time to value by 8%.
Let’s say we’re talking about TrueNorth, which is designed to be the control centre for multichannel marketing teams. We expect users to spend several hours per day active in the software and complete multiple key actions per hour - for example, creating a new campaign or running a campaign simulation.
If we’re optimising to increase avg. key actions per session, we probably also want to reduce the time between key actions and the time to value for new users, as this means they’re getting more value per hour.
66Reduce time between actions
Building upon the previous OKR, reducing the time between key actions should indicate that we’re delivering more value to our users while increasing engagement levels and the stickiness of our product.
- Objective: Reduce time between key actions by 5%.
- Key result: Increase avg. actions per session to ≥11.
- Key result: Avg. session duration of ≥3 hrs.
- Key result: Upselling rate of ≥24%.
- Key result: Customer retention rate of 90%
We would hope to see this align with more time spent in the product (with linear or better increases in key actions) and increases in adoption, renewals and upgrades.
Sales goals & OKRs
In this section, we’re looking at the following sales goals and OKRs:
- Increase sales
- Increase avg. sale value
- Acquire more customers
- Retain more existing customers
- Reduce customer churn rate
- Increase purchases frequency
- Increase customer lifetime value
- Upsell & cross-sell more customers
- Reduce cart abandonment rate
- Increase payment success rate
Aside from increasing sales, we want to optimise performance across the marketing and sales processes to increase customer value - both short and long-term.
67Increase sales
It’s fair to say increasing sales is a top priority for any company but, much like conversions and many of the other metrics we’ve looked at in this article, not all sales are the same. So we have to optimise sales volumes while also keeping an eye on key revenue metrics.
- Objective: Increase annual sales +33% by end of Q4.
- Key result: Maintain avg. sale value of ≥$3,500/yr.
- Key result: Maintain customer retention rate of ≥90%.
- Key result: Maintain avg. customer lifetime value of ≥$22,000.
- Key result: Increase annual revenue to ≥$628,425.
Once again, we have to make sure the avg. sales value remains high enough to hit the revenue target we’re looking to achieve through increased sales. We also need sales performance elsewhere to remain consistent - such as retention rates and lifetime customer value - if a 33% sales increase is going to keep us on track for our broader growth targets.
68Increase avg. sales value
By increasing the average sales value, you can generate more revenue from the same number of deals. Aside from making your sales strategy more effective, this may be a crucial growth strategy if you’re close to managing the maximum volume of customers you can handle with your existing resources.
- Objective: Increase avg. sales value by 12%.
- Key result: Avg. sales value of $3920/yr.
- Key result: Maintain annual sales of ≥180.
- Key result: Maintain monthly sales of ≥15.
- Key result: Increase avg. customer lifetime value to $24,700.
- Key result: Increase annual revenue to $703,836.
To ensure increased sales values result in worthwhile revenue gains, we also need to maintain sales volumes and set targets for our expected increases in customer lifetime value and annual revenue.
69Acquire more customers
Acquiring more new customers may sound like the same thing as increasing sales but this is only one type of sale that’s crucial to business growth - more on the others shortly. For now, acquiring more customers expands your market share, generates revenue from the initial sales and provides a new opportunity for repeat sales/recurring revenue.
- Objective: Increase customer acquisition by 25%.
- Key result: Increase annual acquisitions to ≥160.
- Key result: Increase monthly acquisitions to ≥13.
- Key result: Maintain avg. sales value of $3920/yr.
- Key result: Increase annual revenue from new customers to $627,200.
Once again, we have to pay attention to average sales values because we want to keep increased revenue roughly linear with increased acquisition, which is reflected in our target annual revenue from new customers,
70Retain more existing customers
While new customers are crucial to driving growth, acquisitions can only help so much if you’re losing your existing customers in droves. The key to growth is holding on to your existing customers and capturing new ones, which makes customer retention a priority for every business.
- Objective: Increase customer retention rate to ≥90%.
- Key result: Increase avg. customer lifetime value to $24,700.
- Key result: Increase renewals by 12%.
- Key result: Increase purchase frequency to ≤1.1/yr.
- Key result: Reduce inactive users by 25%.
- Key result: Reduce churn rate to ≥4%.
- Key result: Generate ≥50% of annual revenue from customer retention.
Depending on who you speak to, growth businesses should generate 30%-50% of their revenue from existing customers, highlighting the importance of retention.
71Reduce customer churn rate
Customer churn is essentially the opposite of retention but it’s worth tracking and optimising for this metric independently. Where we might approach customer retention with more focus on revenue metrics, reducing churn requires us to focus on the factors that result in customers no longer buying.
- Objective: Reduce customer churn to ≤4%.
- Key result: Increase renewals by 12%.
- Key result: Increase onboarding completion rate by 30%.
- Key result: Reduce time to value by 8%.
- Key result: Increase avg. key actions per session to ≥10.
- Key result: Increase key actions per session by 33%.
- Key result: Increase adoption rate by 22%.
- Key result: Increase customer service ticket resolutions by 25%
According to insights from Zonka Feedback, poor onboarding is the leading cause of customer churn, followed by weak customer relationships and poor customer service.
Aside from optimising the onboarding process, we want to increase the value users get from our product by reducing time to value, increasing key actions per session and increasing ticket resolution rates. We hope this will contribute to higher adoption rates, product engagement and renewals at the end of contracts.
72Increase purchase frequency
Purchase frequency measures the number of times the average customer buys from you over a defined period. You can calculate this by dividing the number of purchases over the time period in question by the number of unique customers, as shown in this graphic from Smile:
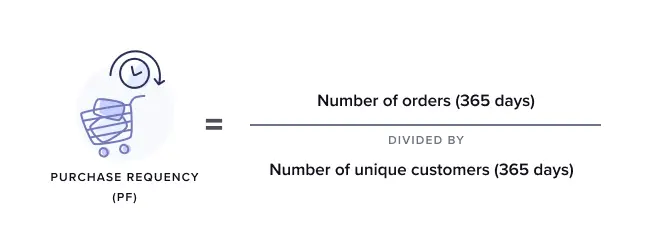
This is an important metric for optimising customer retention but it’s important to understand how this fits into your buying cycle. For example, eCommerce companies may target multiple purchases per year or month from customers but SaaS companies typically sell their products on a 12-month basis so you have to consider this in your calculation.
- Objective: Increase purchase frequency to 1.1/yr.
- Key result: Customer retention rate of ≥90%.
- Key result: Add-on sales to ≥12% of existing customers.
- Key result: Mid-contract upgrades of 8%.
- Key result: Increase avg. customer lifetime value to ≥$28,000.
- Key result: Maintain avg. customer lifetime span of ≥5.2 years.
A purchase frequency of 1.1 per year may not sound great but the top SaaS companies retain ~90% of customers per year, which would put you at a rate of 0.9. Increasing this to 1.1 represents a 22.2% increase in sales, which we’re targeting through sales of product add-ons to existing customers and upgrades from customers during their existing term.
73Increase customer lifetime value
Customer lifetime value (CLV) is the average amount of revenue you earn from a customer throughout their lifetime span. For the last OKR, we defined a key result for increasing customer lifetime value to $28,000 over a span of 5.2 years. This means the average customer relationship lasts for 5.2 years and they spend an average of $28,000 during this period.
Now, let’s define an OKR to increase lifetime value even further.
- Objective: Increase customer lifetime value by 12%.
- Key result: Customer retention rate of ≥90%.
- Key result: Customer lifetime value of ≥$31360.
- Key result: Maintain avg. customer lifetime span of ≥5.2 years.
- Key result: Avg. revenue per user of ≥$6,030/yr.
- Key result: Revenue of ≥$1.5m by end of Q4.
By maintaining customer retention rate and increasing lifetime value, we can drive growth by holding onto our best customers and earning even more from them as we continue to attract new customers.
74Upsell & cross-sell more customers
Upselling and cross-selling are crucial strategies for increasing customer value and, for this example, let’s imagine we’re a software company selling multiple products. So, instead of targeting purchase frequencies of ~1 per year, we can target multiple purchases from as many customers as possible.
- Objective: Increase upsell and cross-sell purchases by.
- Key result: Increase purchase frequency to 1.35/yr.
- Key result: Add-on sales to ≥12% of existing customers.
- Key result: Mid-contract upgrades of 8%.
- Key result: Customers using multiple products: ≥15%.
- Key result: Maintain customer retention rate of ≥90%.
With upselling, our aim is to get customers to upgrade to more expensive plans and we can also cross-sell with the add-ons we mentioned in the previous example. Except, now, we’re also aiming to get 15% of our customers using more than one of our products.
75Reduce cart abandonment rate
Cart abandonment rate measures the percentage of users that fail to complete a purchase after adding an item to their cart. According to data from Baymard Institute, the average cart abandonment rate is 69.82% although it acknowledges that companies could boost conversion rates by +35.26% by improving the checkout experience.
- Objective: Reduce cart abandonment rate by ≥35.26%.
- Key result: Cart abandonment rate of ≤45.2%.
- Key result: Increase form completions by 15%.
- Key result: Reduce submission errors by 30%.
- Key result: Increase payment success rate to ≥95%.
Optimising the final stages of the buying process to reduce cart abandonment rates is one of the most effective ways to increase conversion rates and make your marketing/sales processes more efficient.
76Increase payment success rate
Payment success rate measures the percentage of customers who successfully make their payment upon purchase, upgrade or renewal. For example, if you have 100 customers due to renew their account at the end of the month and five payments fail, you’ve got a success rate of 95%.
Payment completions are important for all purchases but they’re crucial for businesses that take regular payments from their customers, such as SaaS companies, subscription service providers, lenders, etc.
For SaaS companies charging customers every year, the risk of card details changing between payments increases further.
- Objective: Increase payment success rate to ≥95%.
- Key result: Reduce failed renewal payments by ≥37.5% with automated follow-ups.
- Key result: Reduce first-time failed payments by ≥23.5% with improved validation.
- Key result: Increase annual revenue by ≥4.39%.
- Key result: Recover ≥$66,179.25 in failed payments by end of Q4
Optimising payment success rates helps you receive more of the money you earn from customers and most of the strategies required can be fully automated - eg: automatic payment retries, email notices, follow-up messages, payment form validation, etc.
Customer satisfaction goals & OKRs
In this section, we’re looking at the following customer satisfaction goals and OKRs
- Improve Net Promoter Score
- Get more customer feedback
- Increase positive reviews
- Win more customer referrals
- Increase support ticket resolution rate
- Reduce customer support response times
- Reduce avg. ticket resolution time
- Reduce % of unresolved tickets
- Increase customer loyalty
Our aim is to improve the customer experience and increase satisfaction to increase retention and lifetime value while turning existing customers into sales assets via reviews, referrals, etc.
77Improve Net Promoter Score
Net promoter score (NPS) is a feedback metric widely used to measure the perceived quality of customer experiences and the likelihood of customers recommending a company to others - normally on a scale of 1 to 10 or -100 to +100.
Source: Retently.com
So we might define an OKR to improve net promoter scores like this:
- Objective: Increase avg. net promoter score to ≥60.
- Key result: Increase avg. NPS for priority customers to ≥80.
- Key result: Customer retention rate to ≥94%.
- Key result: Avg. purchase frequency of 1.5/yr.
- Key result: Avg. customer lifetime value of ≥$33,000.
- Key result: Increase brand mentions by 30%.
- Key result: Increase positive reviews by 15%.
With net promoter scores, it’s worth segmenting your data for different audience groups so you can gain insights into how your most important customers rate the experience of buying from you. You should aim for higher NPSs from priority clients and make sure that improving scores translates into increased retention, purchase frequency, customer value, etc.
78Get more customer feedback
Customer feedback is an important source of insights from the people who matter most to your company but it’s not always easy to get the feedback you need. Filling out forms is an intensive task but there are plenty of alternatives to explore, such as chatbot embeds or in-app prompts that can help users provide feedback when it matters to them.
So let’s look at an example OKR:
- Objective: Increase monthly feedback submissions by 40%.
- Key result: Generate ≤60% of feedback from always-on tools - eg: chatbots, feedback widgets, etc.
- Key result: Increase prompted feedback submissions by 35%.
- Key result: Increase feedback survey completions by 23%.
By embedding “always-on” tools like chatbots, feedback widgets and review scores, customers can leave feedback when they feel motivated. You can be smart with feedback prompts, too, such as implementing in-app feedback requests for new features in your software products, which could also make feature rollouts more engaging and increase adoption while you’re at it.
79Increase positive reviews
Online reviews are one of the biggest influences on modern purchase decisions and building a strong profile of positive reviews is one of the best things you can do to boost your online profile.
- Objective: Increase positive reviews by 35%.
- Key result: Avg. review score of ≥4.2/5.
- Key result: Avg. NPS score of ≥60.
- Key result: Reach 150+ reviews on Google Reviews by end of Q4.
- Key result: Reach 90+ reviews on Capterra by end of Q4.
- Key result: Reach 90+ reviews on Q2 by end of Q4.
You don’t need perfect review scores to impress potential buyers - in fact, they’re more likely to trust scores between 3.6 and 4.5 out of 5 if you’ve got a healthy volume of reviews on whichever platform they’re using. So we’re also setting numbers targets for Google Reviews and websites including Capterra and Q2 because higher review counts make the scores more trustworthy.
80Win more customer referrals
Customer referral programmes have been one of the most successful growth marketing strategies of the startup age, featuring in our top 30+ growth marketing strategy examples. By incentivising existing customers to introduce your product to the people they know, you can multiply customer acquisition and secure new buyers outside the reach of your inbound marketing strategies.
- Objective: Increase referral sales by 125%.
- Key result: Referral conversion rate of ≥35%.
- Key result: Participation rate of ≥60%
- Key result: Avg. ≥2.7 referrals per customer.
- Key result: Generate ≤$1.79m from referral sales by end of Q4.
A successful referral programme is one of the most effective ways to drive exponential growth, especially for SaaS companies that typically generate referral conversion rates +30% higher than industry-wide averages.
81Increase support ticket resolution rate
Support ticket resolution rate measures the percentage of tickets raised by customers that you successfully resolve over a defined period. Obviously, you have to define what counts as a resolution to you and your customers (these can be two very different things) and consider this in your calculations.
Source: HelpDesk.com
To increase ticket resolution rates, we might define an OKR like this:
- Objective: Increase ticket resolution rate by 25%.
- Key result: Avg. ticket resolution rate of ≤90%.
- Key result: Avg. customer satisfaction score of ≤70%.
- Key result: Maintain avg. net promoter score of ≥60.
- Key result: Increase retention rate to ≤95%.
By increasing support ticket resolution rates, you should keep a larger volume of your customers happier for longer, which should boost retention rates and other customer value metrics, such as purchase frequency, lifetime value, etc.
82Reduce customer support response times
Response times is another important KPI for measuring customer support performance. Fast response times tell your customers that you take their issues seriously and you want to resolve them as quickly as they do.
To reduce response times we might set the following OKR:
- Objective: Reduce first response time by 35%.
- Key result: Avg. response time ≤1.5 hrs.
- Key result: Avg. ticket resolution time of ≤12 hrs.
- Key result: Avg. ticket resolution rate of ≤90%.
- Key result: Avg. customer satisfaction score of ≤70%.
- Key result: Increase retention rate to ≤95%.
In the modern age of automation, every company should have a first response time (FRT) of under 60s but the problem with including automated responses in your FRT calculations is that you’re not measuring the real performance of your support team - so leave this out or create two distinct metrics.
83Reduce avg. ticket resolution time
Responding quickly to support tickets is great but it becomes a vanity metric if you’re not actually resolving tickets quickly enough. Average ticket resolution time tells you how long it takes your support team to resolve issues for your customers.
So let’s define an OKR to reduce avg. resolution times.
- Objective: Reduce avg. ticket resolution time by 22%.
- Key result: Avg. response time ≤1.5 hrs.
- Key result: Avg. ticket resolution time of ≤12 hrs.
- Key result: Avg. ticket resolution rate of ≤90%.
- Key result: Avg. customer satisfaction score of ≤70%.
- Key result: Increase retention rate to ≤95%.
We still want to reduce average response times and maintain our target resolution rate but we want to close cases faster while improving overall customer satisfaction and retention rates.
84Reduce % of unresolved tickets
Earlier, we looked at increasing ticket resolution rates and the opposite metric to optimise is the percentage of unresolved tickets. You need to understand why certain tickets remain unresolved and find opportunities to reduce the percentage of customer issues that remain unresolved.
Then, you can start setting targets - for example:
- Objective: Reduce unresolved tickets by 5%.
- Key result: Avg. unresolved ticket rate of ≥10%.
- Key result: Avg. ticket resolution rate of ≤90%.
- Key result: Avg. customer satisfaction score of ≤70%.
- Key result: Increase retention rate to ≤95%.
Again, we want to make sure that reducing unresolved rates carries over into increased customer satisfaction scores and retention rates.
85Increase customer loyalty
Customer loyalty describes the extent to which your customers will continue to buy from you instead of your competitors. This is an important distinction from retention, which simply measures the percentage of customers who continue buying without any qualification of loyalty.
The more loyal customers are to you, the less likely they are to buy from rival companies.
Sadly, there’s no reliable customer loyalty metric we can track for this so this is another OKR that’s going to have a vague objective that’s specified through its key results.
- Objective: Increase customer loyalty.
- Key result: Increase avg. net promoter score to ≤70.
- Key result: Increase avg. purchase frequency to ≤1.7/yr.
- Key result: Avg. customer lifetime value of ≤$33,000.
- Key result: Referral programme participation rate of ≥60%
- Key result: Avg. customer satisfaction score of ≤70%.
- Key result: Customer retention rate of ≤95%.
To gauge customer loyalty we have to build a rounded picture of customer satisfaction and involvement with our product/brand. We could also look at adoption rates for new products/features, brand mentions following announcements - not only from ourselves but also our rivals.
Revenue goals & OKRs
In this section, we’re looking at the following revenue goals and OKRs:
- Increase revenue
- Increase profit
- Generate more revenue per customer
- Reduce cost per customer
- Improve ROI
- Reduce marketing expenses
- Increase growth rate
- Generate more recurring revenue
By optimising revenue and profitability, you can make sure your marketing efforts make a real impact on the financial performance and growth of your business.
86Increase revenue
Increasing revenue is one of the top priorities for businesses across every department but what does this really mean from a marketing perspective? As with any broad objective, you have to specify the channels, metrics and targets that will achieve this goal.
- Objective: Increase revenue +35% end of Q4.
- Key result: Increase sales by 25%.
- Key result: Increase avg. conversion value by 8%.
- Key result: Increase purchase frequency to 1.7/yr.
- Key result: Increase onboarding completions by 30%.
- Key result: Increase customer retention to ≥95%.
For this OKR, we’ve identified the opportunities to optimise performance that will generate increased revenue. We’re not simply looking to sell more products but also make our marketing and sales processes more efficient by optimising the onboarding process, increasing the avg. conversion value and boosting the frequency of purchases each customer makes every year.
87Increase profit
We’ve spent a lot of time talking about revenue in this article but plenty of high-revenue companies fail to make any profit - Slack and Uber being some of the most famous recent examples. The lesson here is that revenue doesn’t always result in profit if you’re spending too much to drive growth, pay the bills or stay relevant in a competitive market.
This is an important distinction.
- Objective: Increase profit +24% by end of Q4.
- Key result: Increase revenue by 35%.
- Key result: Increase avg. conversion value by 8%.
- Key result: Increase revenue per customer by 12%.
- Key result: Reduce cost per acquisition by 3.5%.
- Key result: Increase onboarding completions by 30%.
- Key result: Reduce cart abandonment rate by 15%.
As we’re targeting profit with this OKR, we have to increase the difference between revenue and marketing costs. Generating more revenue will help but we have to reduce expenses elsewhere to improve profit margins -for example, reducing cost per acquisition.
We can also increase profit by improving the ROI from the money we spend on marketing. This can involve increasing avg. conversion values, optimising onboarding and reducing cart abandonment to get more from the leads we’re investing in.
88Generate more revenue per customer
A key strategy for increasing marketing profitability is to increase the revenue generated from each customer while maintaining expense metrics like cost-per-acquisition (CPA).
- Objective: Increase revenue per customer by 12%.
- Key result: Maintain cost-per-acquisition of ≤$250.
- Key result: Increase avg. conversion value by 8%.
- Key result: Increase purchase frequency to 1.7/yr.
- Key result: Customer retention rate of ≥95%.
- Key result: Reduce churn by 3%.
- Key result: Reduce failed payments by 33%.
- Key result: Avg. customer lifetime value of $38,000.
With this OKR, we’re doing everything we can to generate more revenue from each customer without increasing our marketing expenses.
89Reduce cost per customer
Sticking with the theme of marketing and sales expenses, cost per acquisition (CPA) or cost per customer accession (CAC) refers to how much you spend to secure the average customer. You can increase the profitability of your marketing strategies by reducing the cost per acquisition, as long as you carefully maintain conversion rates, avg. conversion value and other revenue-generating KPIs.
- Objective: Reduce cost per customer acquisition by 13%.
- Key result: Maintain avg. conversion rate of 17%.
- Key result: Maintain avg. revenue per customer of $6,785/yr.
- Key result: Reduce failed payments by 33%.
- Key result: Avg. customer lifetime value of $38,000.
- Key result: Customer retention rate of ≥95%.
We have to make sure that reducing the cost per customer is making our marketing and sales processes more efficient, not reducing avg. revenue per customer or lifetime value in any way.
90Improve ROI
Marketing ROI is one of the most popular used metrics to measure marketing efficiency but it’s also widely misunderstood. The issue is, that a lot of marketers and business owners think of return on investment (ROI) as a profitability metric but it’s not effective for this type of business application.
Return on investment was created to measure and compare the profitability of investments at one specific moment, not ongoing business/marketing performance over time. Practically speaking, the big issue with ROI is that it doesn’t consider expenses - of which there are plenty in business and marketing - and this means higher ROIs don’t always result in higher profit.
That being said, as long as we understand the intricacies of ROI and the other performance metrics to analyse, we can make sure higher returns translate into more profit.
- Objective: Increase avg. ROI across campaigns to 600%.
- Key result: Minimum ROI of 350% (pause and optimise anything lower).
- Key result: Increase revenue by 15%.
- Key result: Reduce marketing expenses by 5%.
- Key result: Increase avg. deal value by 2.5%
- Key result: Increase customer lifetime value by 4.5%.
- Key result: Increase purchase frequency to ≤1.7/yr.
- Key result: Increase profit +10% by end Q4.
For this OKR, we’re setting our average ROI target across all campaigns and a minimum benchmark for individual campaigns. This way, we can pause anything that falls short and optimise to boost performance or allocate more of our budget to campaigns generating higher returns.
Of course, we expect to see revenue increase as we optimise ROI but we’re also aiming to reduce our marketing expenses while increasing avg. deal value, customer lifetime value and purchase frequency - KPIs that will see us generate more profit from every deal. And, to make sure we’re hitting those profit targets, we’re also defining a key result to increase annual profit +10% by the end of Q4.
91Reduce marketing expenses
We’ve looked at several goals centred around reducing marketing costs already in this article and we always suggest a little caution. Intelligent reductions can make your marketing strategies more efficient but you don’t want to stifle performance by cutting back where higher spends could, in fact, generate more returns and profit.
With this in mind, let’s take a look at an example OKR for reducing marketing expenses, not to reduce our budget but to make our campaigns more cost-efficient.
- Objective: Reduce marketing expenses by 5%.
- Key result: Reduce cost-per-lead by 6%.
- Key result: Reduce cost-per-action by 3%.
- Key result: Reduce marketing software spend by 4%.
- Key result: Cut outsourcing expenses -7% with automation.
- Key result: Pause campaigns with ROI ≤350%.
- Key result: Maintain growth rate of ≤35%.
For this OKR, we’ve defined several areas we think we should cut expenses to make our marketing processes more efficient. However, we want to make sure none of these cuts hold back business growth so we’re designing a key result to maintain a ≤35% growth rate and we could also include targets to maintain lead volume, lead quality and other inbound KPIs to make sure that we’re optimising performance by carefully reducing spend, not hurting it.
92Increase growth rate
Growth rate metrics aim to measure business growth over a defined period, normally on a month-to-month or annual basis. Some of the most common growth rate metrics are:
- Revenue growth rates (usually including sales, earnings, and cash flow)
- User acquisition growth rates
- Daily active user (DAU) growth rates
- Monthly active user (MAU) growth rates
- Average annual growth rates (AAGR)
The most important growth rate metrics for your business depend on the KPIs that align most directly with your objectives. For example, a retail brand may prioritise revenue growth rates while early-stage tech startups might care more about monthly active user growth rates. In most cases, you’ll want to track several growth rate metrics alongside other key performance indicators.
- Objective: Increase revenue growth rate to ≤35%.
- Key result: Generate $≤1.7m revenue by end of Q4.
- Key result: Maintain ≤18% profit margin.
- Key result: Increase user acquisition by 50%.
- Key result: Increase customer retention to ≤95%.
- Key result: Increase avg. revenue per customer to ≤6,030/yr.
While our primary objective is to increase revenue growth rate in this OKR we want to make sure this growth is profitable so we’ve defined targets for profit margin, increased user acquisition and the revenue generated from each customer - both from annual deals and retention.
93Generate more recurring revenue
Recurring revenue is crucial for any business that sells its products or services on a subscription basis or any other model of repeat payments. This is becoming increasingly common in the age of subscription services where everything from home streaming to business software is provided for monthly or yearly fees.
Recurring revenue is normally calculated with one of two metrics: monthly recurring revenue (MRR) or annual recurring revenue (ARR).
- Objective: Increase monthly recurring revenue by 25%.
- Key result: Monthly recurring revenue of ≥$99,750.
- Key result: Avg. revenue per customer of ≥$399/mo.
- Key result: Customer retention rate of ≤95%.
- Key results: Avg. customer lifespan of ≤5.2 yrs.
- Key result: Avg. purchase rate of 1.7/yr.
- Key result: Maintain ARR rate of ≥83%.
The basic calculations for recurring revenue simply multiply avg. revenue per customer over the defined period by the total number of paying customers. However, this calculation doesn’t take into consideration
Marketing effectiveness goals & OKRs
In this section, we’re looking at the following goals and OKRs for marketing effectiveness:
- Make marketing processes more efficient with automation
- Reduce time per marketing action
- Reduce time spent in meetings
- Improve the quality of campaign ideas
- Implement marketing ideas faster
- Increase % of successful campaigns
- Reduce optimisation response time
- Allocate budgets more effectively
Our aim is to optimise marketing and sales processes to make them as efficient as possible and maximise returns from spend, time and other resources.
94Make marketing processes more efficient with automation
Marketing efficiency has many definitions and you have to look at a wide variety of metrics to build an accurate picture of effectiveness. To many marketers, efficiency means closing valuable deals at the lowest possible expense while others prioritise speed and growth rates.
For our example OKR, we’re going to use automation to help us close more deals with the same budget and resources, as well as hold on to our customers for as long as possible to maximise lifetime value.
- Objective: Increase marketing efficiency with automation.
- Key result: Increase lead closure rate to 33%.
- Key result: Increase onboarding completions by 45%.
- Key result: Reduce cost-per-acquisition by 5%.
- Key result: Increase purchase frequency to ≥2.2/yr.
- Key result: Increase customer retention to ≥95%.
- Key result: Increase lifetime customer value to ≥$33,000.
To hit these targets, we might revamp our email marketing and sales strategies with intelligent, highly targeted campaigns that nurture more of our leads (which we’ve already invested in) into conversions. Next, we could automate the onboarding process to ensure more conversions materialise into paying customers and engaged users - not only by creating a more immersive onboarding process but automatically reaching out to users who experience problems.
With more deals closed, our cost-per-acquisition will reduce (boosting the financial efficiency of our marketing processes) and we can enhance the customer experience further with automation to increase purchase frequency, customer retention and lifetime customer value.
95Reduce time per marketing action
Time efficiency is a challenge for every marketer and the pursuit of ultimate productivity only becomes more difficult as the demands of modern marketing increase. By tracking the average time spent on marketing actions, you can identify the activities that are dragging down productivity as well as the high-impact marketing actions that deserve more of your time.
Of course, we have to make sure that trimming the time spent on marketing activities is boosting efficiency, not limiting performance.
- Objective: Reduce avg. time per marketing action by 25%.
- Key result: Reduce time on low-value actions by 50%.
- Key result: Reduce time on automatable actions by 85%.
- Key result: Reduce delays between key actions by ≥30% (eg: campaign approvals).
- Key result: Reduce time to convert by 33%.
- Key result: Maintain avg. 600 MQLs per month.
- Key result: Maintain avg. lead score of ≥7/10.
- Key result: Maintain avg. lead closure rate of 27%.
- Key result: Maintain avg. deal value of ≥$6030/yr.
For this OKR, we’re setting targets to maintain key marketing and sales KPIs to ensure our marketing activities are becoming more effective. We want to maintain lead generation, lead quality and deal value while reducing the time spent on low-value actions and tasks that could be automated. Hopefully, this will enable us to close deals faster, enabling us to manage a higher volume of leads in the near future.
96Reduce time spent in meetings
At Venture harbour, we regularly evaluate our marketing processes to look for inefficiencies that could free up time, budget and other resources for more effective use. We’ve found that traditional marketing meetings are one of the time hogs, especially for agile teams. Yes, they’re a necessity but without careful management, they become a low-value, time-intensive drag on resources.
So we set out to significantly reduce the amount of time we were spending in meetings every week.
- Objective: Reduce time spent in meetings by 33%.
- Key result: Reduce meetings per week by 23%.
- Key result: Reduce avg. meeting length to ≤10 mins.
- Key result: Reduce avg. meeting attendees to ≤5 people.
With the right automation tools, you can slash the amount of time your team needs to spend in marketing meetings and put this time to better use elsewhere. For example, we use TrueNorth to run meeting-less idea sessions, which helps us generate marketing ideas virtually so we’ve got more to work with when we hold our first creative meeting.
By running virtual idea sessions, we can remove one of the most time-consuming meetings from our schedule. And, aside from that, our team is also better prepared for the next creative meetup with a list of fleshed-out ideas that we can discuss and develop further.
97Improve the quality of campaign ideas
Keeping on the subject of marketing ideation, another priority for us while reviewing our creative processes is improving the quality of our marketing ideas. As mentioned in the previous example, running meeting-less ideation sessions has boosted the quality of ideas our team members take into the first campaign meeting but we wanted to go further than this.
We wanted to produce better marketing ideas (goal completion rate) and produce them faster.
- Objective: Improve the quality of campaign ideas.
- Key result: Increase campaign goal completion rate (GCR) by ≥19%.
- Key result: Goal completion rate (GCR) of ≥85%.
- Key result: Reduce avg. time to complete goal by ≥12%.
- Key result: Reduce time spent in meetings by ≥33%.
Once again, automation plays a key role in helping us achieve this goal and the campaign simulator in TrueNorth is integral.
We can use the simulator to predict the results of our campaign ideas, based on historical performance, allowing us to prioritise our best ideas and run with campaigns forecast to achieve the best results.
So, we can run a meeting-less ideation session, create a list of ideas to discuss and simulate them in a fraction of the time it would take to develop campaigns through a series of meetings. Crucially, our ideas are tested and prioritised so we can choose our best ideas with confidence before we dedicate any budget or resources to them.
98Implement marketing ideas faster
Implementation speed is important in marketing because things change quickly and the data you use to make decisions only remains relevant for so long. Let’s say you’re launching a campaign based on market research that informs feature offerings in your next product - all it takes is one competitor to release a rival product or competing features for your plans to fall apart.
With meeting-less ideas and campaign simulation, we’re already reducing the time it takes to produce winning marketing ideas but, now, we need to put them into action faster.
- Objective: Implement marketing ideas ≥25% faster.
- Key result: Approve campaign ideas 85% faster.
- Key result: Reduce campaign planning time by ≥35%.
- Key result: Reduce manual implementation tasks by 18% (automation).
- Key result: Maintain goal completion rate of ≥85%.
Aside from helping us test and prioritise campaign ideas, simulation also drastically reduces the time we need to spend on campaign approval, which can slow down implementation. Next, we need to plan campaign timelines and assign teams, tasks and roles faster - something you can do with the right marketing planning software.
99Increase % of successful campaigns
Earlier, we defined an OKR for improving the quality of campaign ideas, setting a target for campaign goal completion rate (GCR) as a key result. This time, GCR is our priority as we look to increase the percentage of campaigns that get the desired results.
- Objective: Increase campaign goal completion rate (GCR) by ≥19%.
- Key result: Goal completion rate (GCR) of ≥85%.
- Key result: Reduce avg. time to complete goal by ≥12%.
- Key result: Reduce time spent in meetings by ≥33%.
- Key result: Maintain current marketing budget.
Essentially, we want to increase our campaign success rate while maintaining our current budget to improve marketing efficiency. We also want to reduce the time it takes to achieve our goals, on average, by using campaign projections to set benchmarks and optimising campaigns that fall short of projections to improve performance.
#100: Reduce optimisation response time
Most marketing teams launch new campaigns and analyse them for days or weeks before they can determine whether performance is on-track for success. For campaigns that fall short of expectations, this means you have to fight hard to get performance back on track and wait even longer to see the results you need, even if you manage to optimise your way back to success.
This approach is outdated in the age of big data and marketing teams should use predictive analytics to forecast results and reduce the time it takes to intervene and optimise underperforming campaigns.
- Objective: Reduce optimisation response time by ≥30%.
- Key result: Avg. optimisation response time of ≤12 hrs.
- Key result: Reduce avg. time to complete goal by ≥12%.
- Key result: Increase campaign goal completion rate (GCR) by ≥19%.
- Key result: Increase goal completion rate (GCR) to ≥85%.
By comparing the performance of new campaigns against data forecasts, we can see how far real-world results are away from projections and intervene significantly faster. This allows us to respond before performance drops even further and, potentially, harms results elsewhere. This should also reduce the avg.. time it takes to complete campaign goals, increase our success rate and reduce the amount of budget we waste on underperformance.
#101: Allocate budgets more effectively
The examples we’ve looked at in this section have all been geared towards improving marketing effectiveness. To round this up, our final objective is to maximise the effectiveness of budget allocating to increase ROI and ensure our marketing spend is always channelled to where it makes the strongest positive impact.
- Objective: Increase ROI +35% by allocating budgets more effectively.
- Key result: Increase avg. ROI across campaigns to 600%.
- Key result: Minimum ROI of 350% (pause and optimise anything lower).
- Key result: Allocate ≥60% of budget to campaigns achieving ≥600% ROI.
- Key result: Reduce optimisation response time by ≥30%.
- Key result: Increase goal completion rate (GCR) to ≥85%.
We’ve selected return on investment (ROI) as our KPI for this objective because we’re not looking to reduce spend in any way but, rather, redistribute it into our most effective campaigns/channels. In other words, we want the majority of our budget invested where performance is highest - specifically, at least 60% of our budget spend on campaigns achieving 600% ROI or more.
We’re also going to pause and optimise anything that falls below an ROI of 350% and respond to underperforming campaigns 30% faster.
What’s your next big marketing goal?
We’ve covered a lot of marketing goals and OKRs in this article and mentioned tools that will help you achieve them where relevant.
With TrueNorth, you can set marketing goals, generate ideas faster and test them to invest more of your budget in your best ideas. Once your campaigns are live, you can track all of your performance data in TrueNorth, compare results against campaign simulations and test changes to make sure you achieve your goals on time.
For more software recommendations, take a look at the following articles:
FAQ
What is the difference between marketing goals and OKRs?
Marketing goals are specific targets you want to achieve, whilst OKRs (Objectives and Key Results) are a framework for setting and tracking those goals. OKRs consist of qualitative objectives paired with measurable key results, making them more structured than traditional goal-setting approaches.
What are some examples of marketing OKRs?
Marketing OKR examples include increasing organic traffic by 40%, improving email open rates to 35%, and growing social media followers by 50%. These combine specific objectives (like boosting organic reach) with measurable key results that define success clearly.
How do you set effective marketing OKRs?
Start by defining clear, qualitative objectives aligned with business priorities, then attach 3-5 measurable key results with specific targets and timelines. Use the SMART framework to ensure each key result is Specific, Measurable, Achievable, Relevant, and Time-bound.
What are good OKRs for content marketing?
Effective content marketing OKRs focus on metrics like publishing frequency, engagement rates, and lead generation. Examples include publishing 20 high-quality blog posts monthly, achieving 50,000 monthly organic views, or generating 100 qualified leads from content.
What should social media marketing OKRs include?
Social media OKRs should track follower growth, engagement rates, and conversion metrics rather than vanity metrics alone. Set targets like increasing engagement rate by 25%, growing followers by 30%, or driving 500 website clicks from social posts monthly.
How often should you review marketing OKRs?
Most organisations review OKRs quarterly to assess progress and adjust strategies based on performance data. Weekly check-ins on key metrics help identify issues early, whilst quarterly reviews determine whether to maintain, modify, or abandon specific OKRs.
What are realistic email marketing OKRs?
Email marketing OKRs should target open rates of 25-35%, click-through rates of 2-5%, and conversion rates aligned with your industry benchmarks. Additional goals might include growing your email list by 20% monthly or reducing unsubscribe rates by 10%.